
Goal: make public transit and railways fair, efficient and seamless, from how agencies are funded, to how seats, lines and timetables are planned, to how rail connects with airports and future air taxis.
At a glance: (1) new revenue management in public transit: Tradable Equity Credits (TECs) and railway seat inventory control · (2) railway management: network analysis, AI demand forecasting on computational graphs, line planning, timetabling & air–rail integration, and urban air mobility (UAM).
Real-World Case Studies at Scale
| City / region | Problem | Scale | Papers |
|---|---|---|---|
| Sioux Falls, SD | Tradable equity credits on transit and road networks | 8,898-node / 23,415-link road network · 191-node / 550-link transit network · 32 census tracts · 4 income groups | Wu et al. 2026 TR-E; Wu et al. 2025 Transportmetrica A |
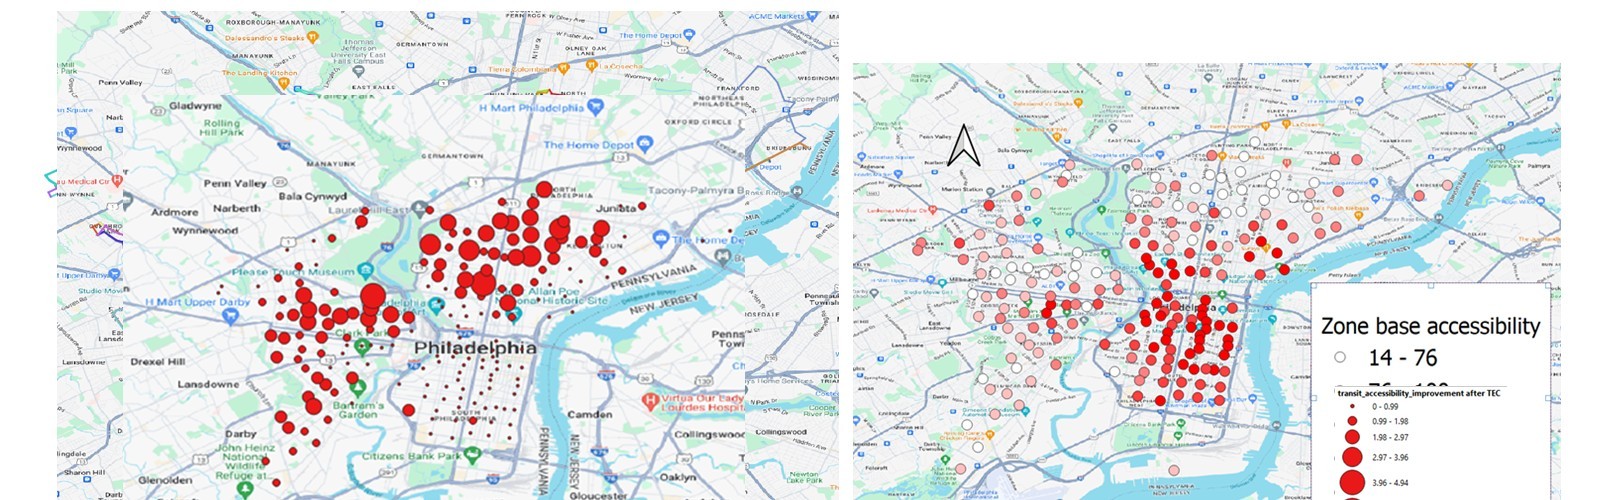
| Philadelphia, PA | Transit accessibility under equity credits | Citywide transit (GTFS) and road networks, census-tract accessibility | FTA EMI project |
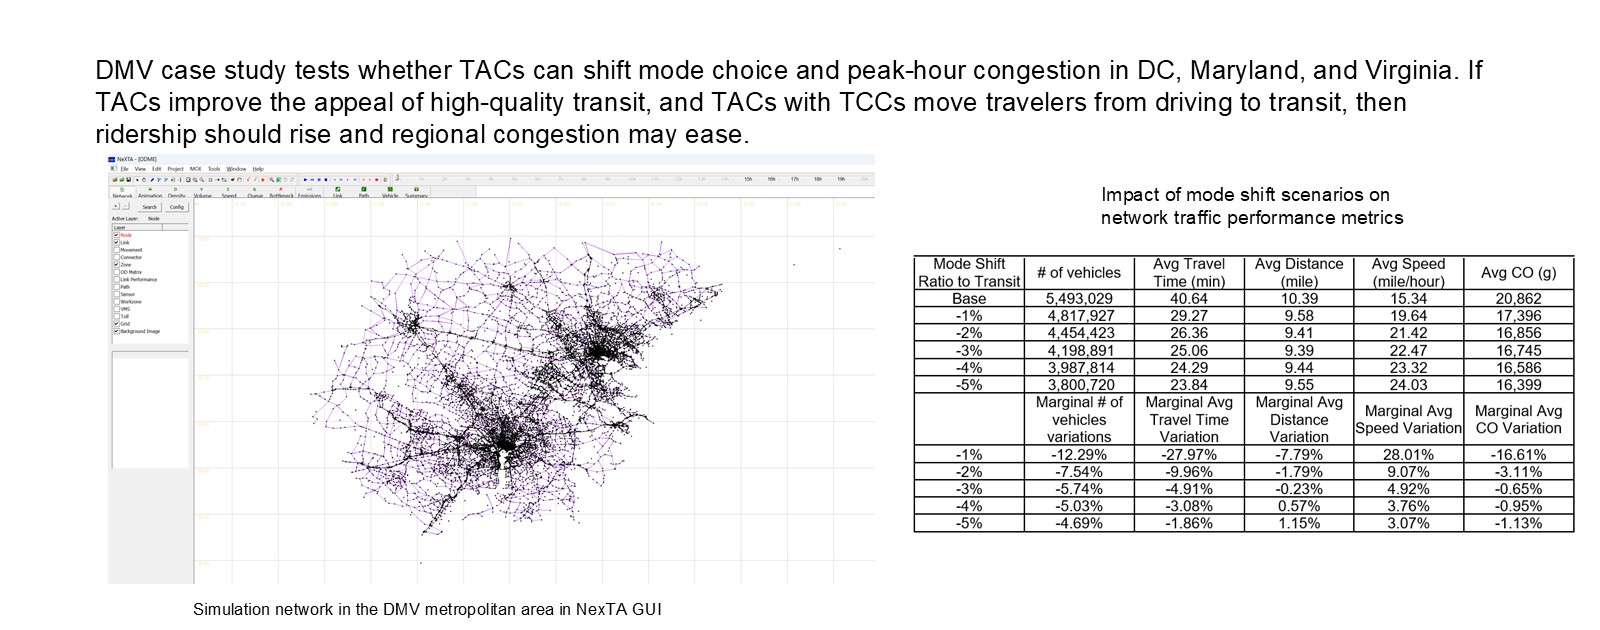
| Washington D.C.–Maryland–Virginia | Regional mode-shift simulation under affordability and carbon credits | About 5.49 million simulated vehicles in the base scenario | FTA EMI project |
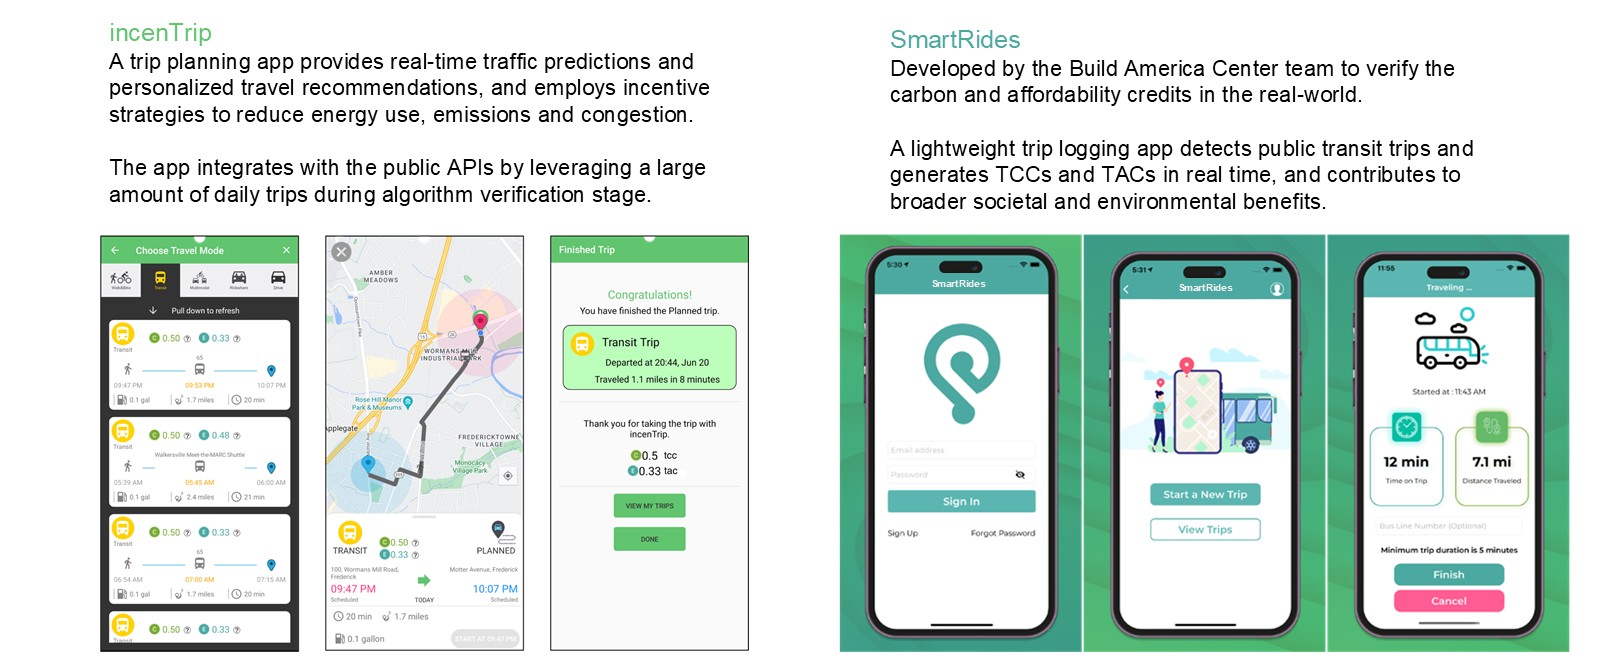
| College Park, MD & Lafayette, IN | Field pilots of incenTrip / SmartRides credits; CityBus Route 10 | 52 testers · 281 trips · 1,444 miles (Feb–Mar 2025) | FTA EMI project |
| Beijing–Shanghai HSR | Railway demand learning; line planning | 1,318 km, 23 stations · 125 OD pairs analyzed · line pools up to 107 lines / 293 trains | Wu et al. 2025 TR-E; Zhang et al. 2020 NETS; Nie et al. 2023 CACIE |
| Beijing–Guangzhou HSR & Zhengding Airport | Air–rail timetable synchronization | 14 stations, 112 trains (16 serving the airport station); 20-station network, 150 trains, 76 flights, 1,933 passengers in 638 OD pairs | Ke et al. 2020 JAT; Ke et al. 2024 TR-C |
| China national railway | Complex-network analysis | 2,848 stations and 6,397 passenger trains → 255 city nodes, 1,090 edges | Wang et al. 2020 CSF |
| Beijing–Tianjin–Hebei & Yangtze River Delta | Urban air mobility + HSR hub-and-spoke design | Candidate vertiports and HSR stations in two megaregions | Wu et al. 2026 URT |
1. New Revenue Management in Public Transit
Revenue management in public transit must balance farebox revenue with equity and with network-wide capacity shared by many trips. My work develops new revenue-management mechanisms for transit agencies and railways.
1.1 Tradable Equity Credits (TECs)
A market-based equity policy: agencies earn credits by surpassing equity targets and incur debts when they fall short; credits are priced and traded. Nonlinear programming models let agencies maximize farebox revenue and meet equity goals, with dynamic pricing for heterogeneous travelers.
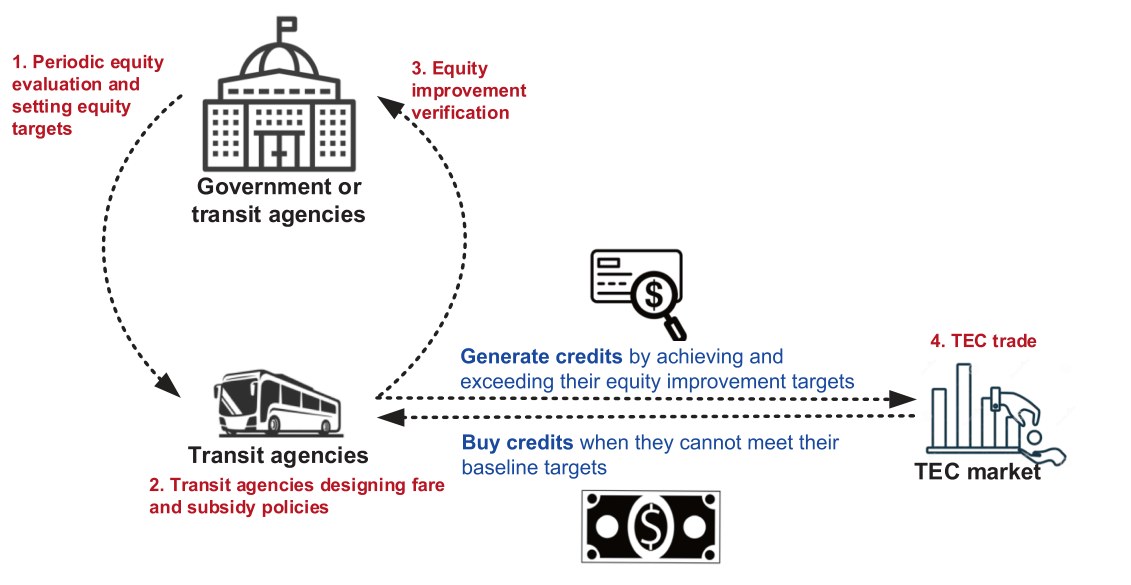
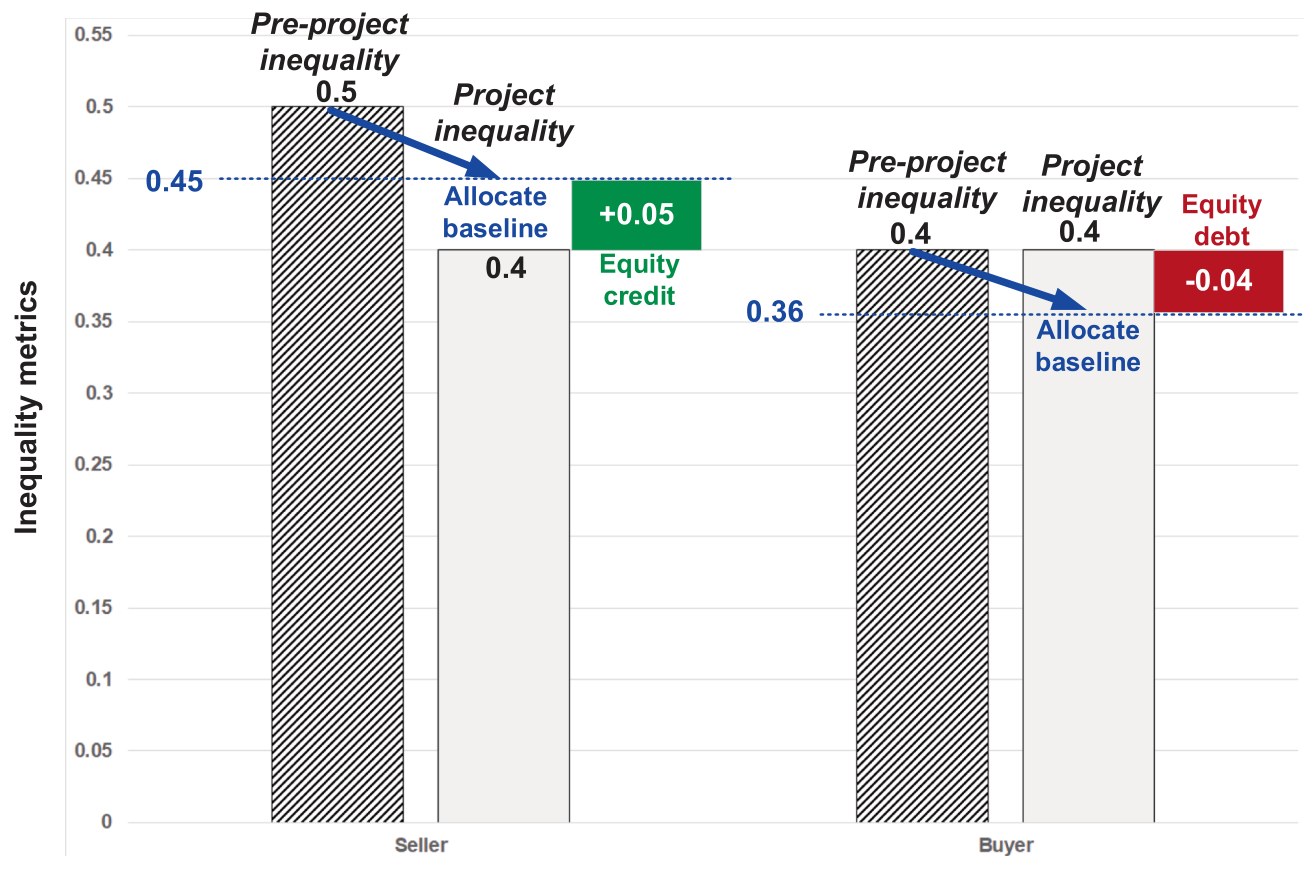
The TEC baseline-and-credit mechanism (Wu et al., 2026, TR-E; Wu et al., 2025, Transportmetrica A).
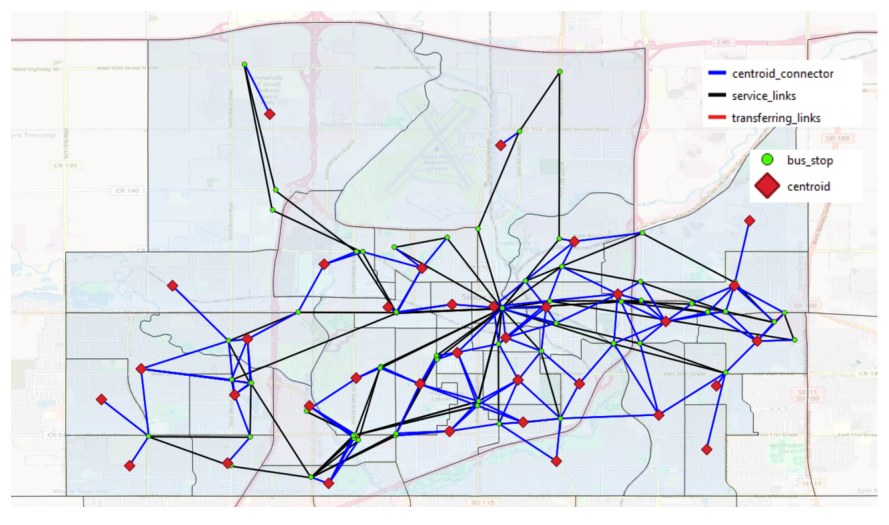
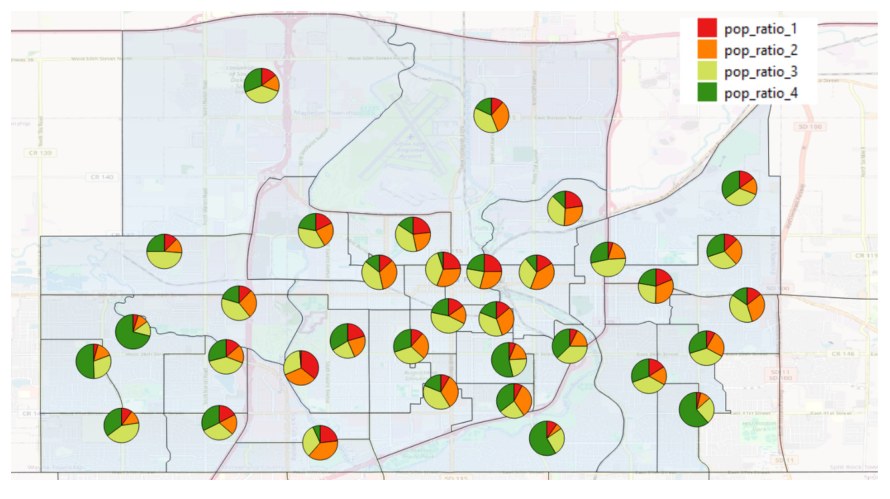
Sioux Falls, SD case study (Wu et al., 2026, TR-E; Wu et al., 2025, Transportmetrica A).

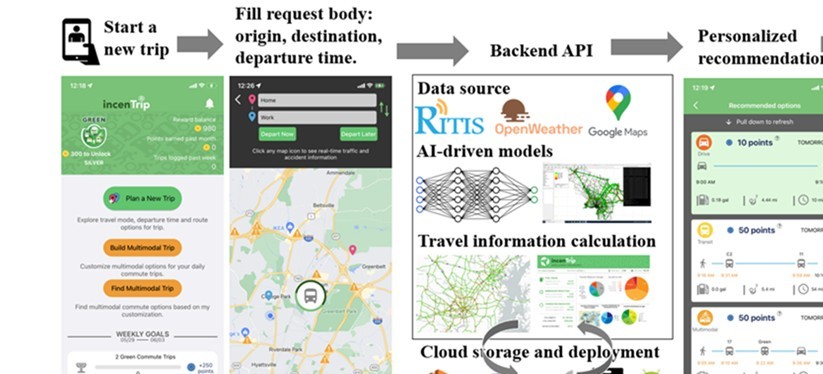
From models to pilots. In the FTA-funded project Enhancing Mobility Innovation: Software-Based Solutions for Smart and Equitable Travel Demand Management (with the University of Maryland Build America Center), TECs became Transit Affordability Credits and Transit Carbon Credits, served through public APIs and the incenTrip and SmartRides apps. Case studies cover Sioux Falls, Philadelphia and the Washington D.C. region, and pilot tests ran in College Park, MD and Lafayette, IN (52 testers, 281 trips, 1,444 miles, Feb–Mar 2025).
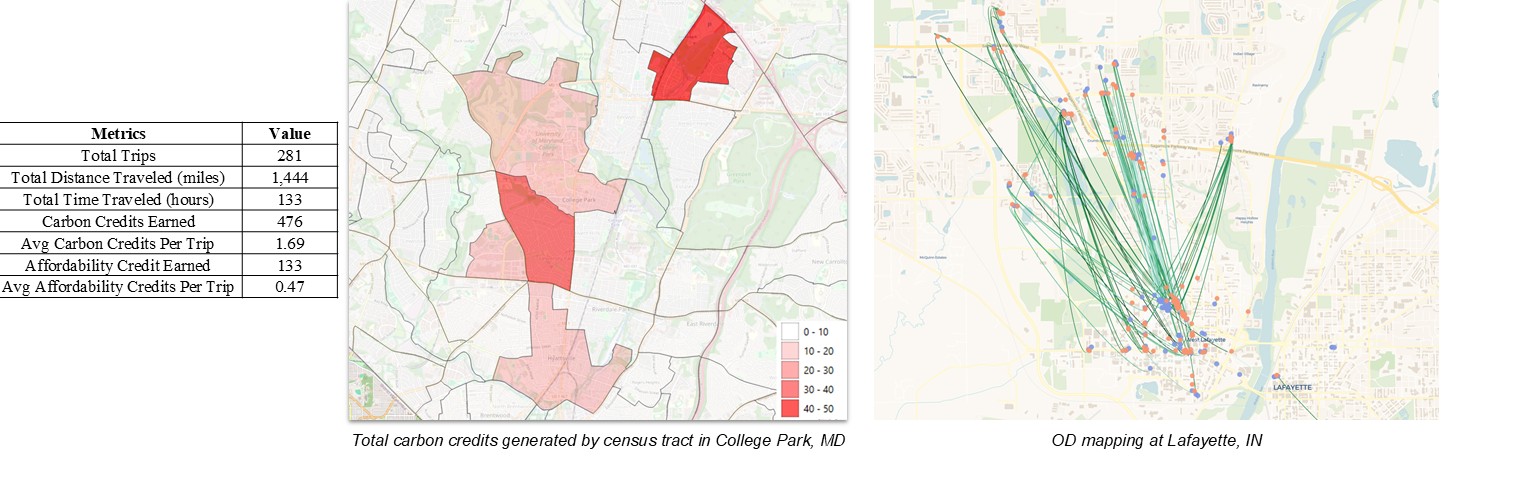
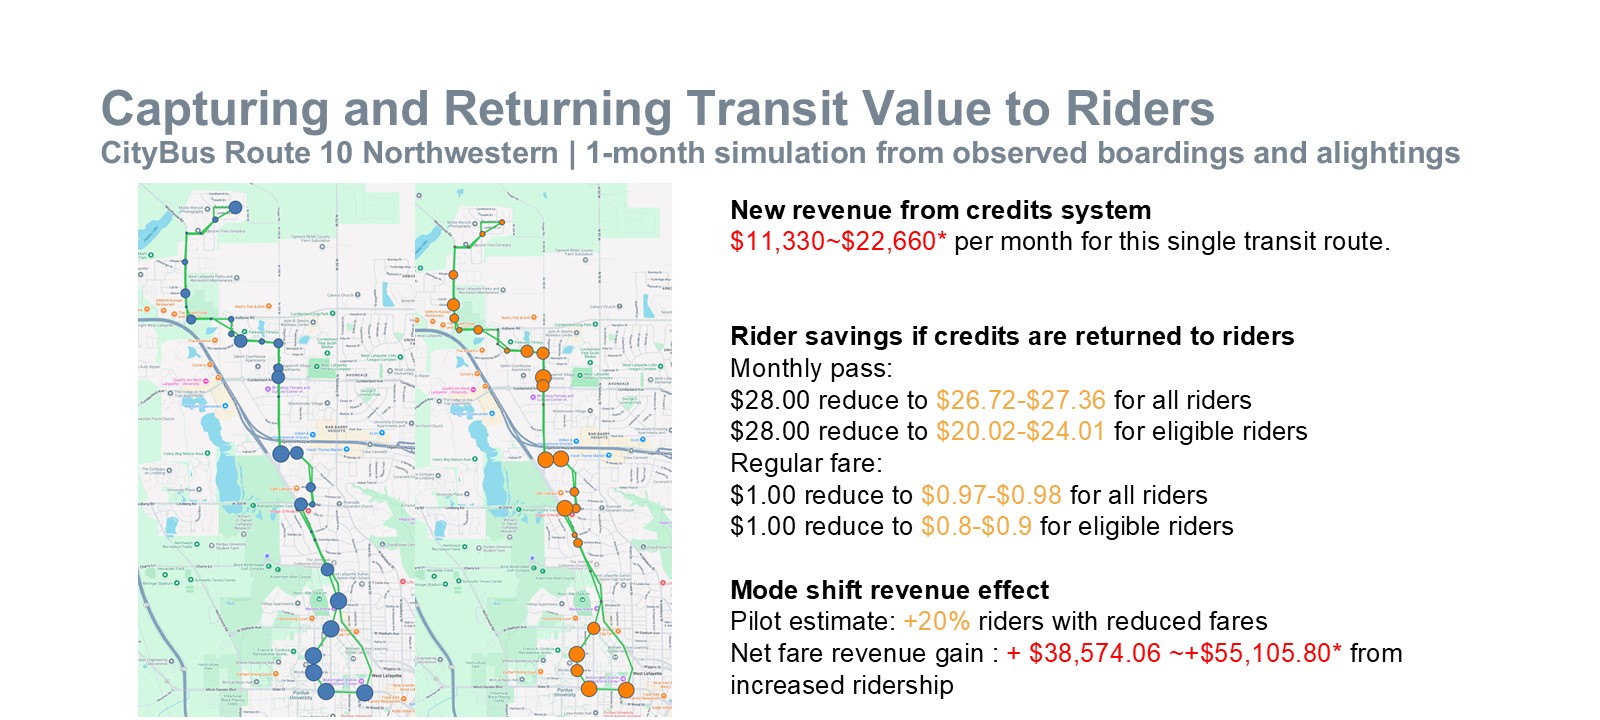
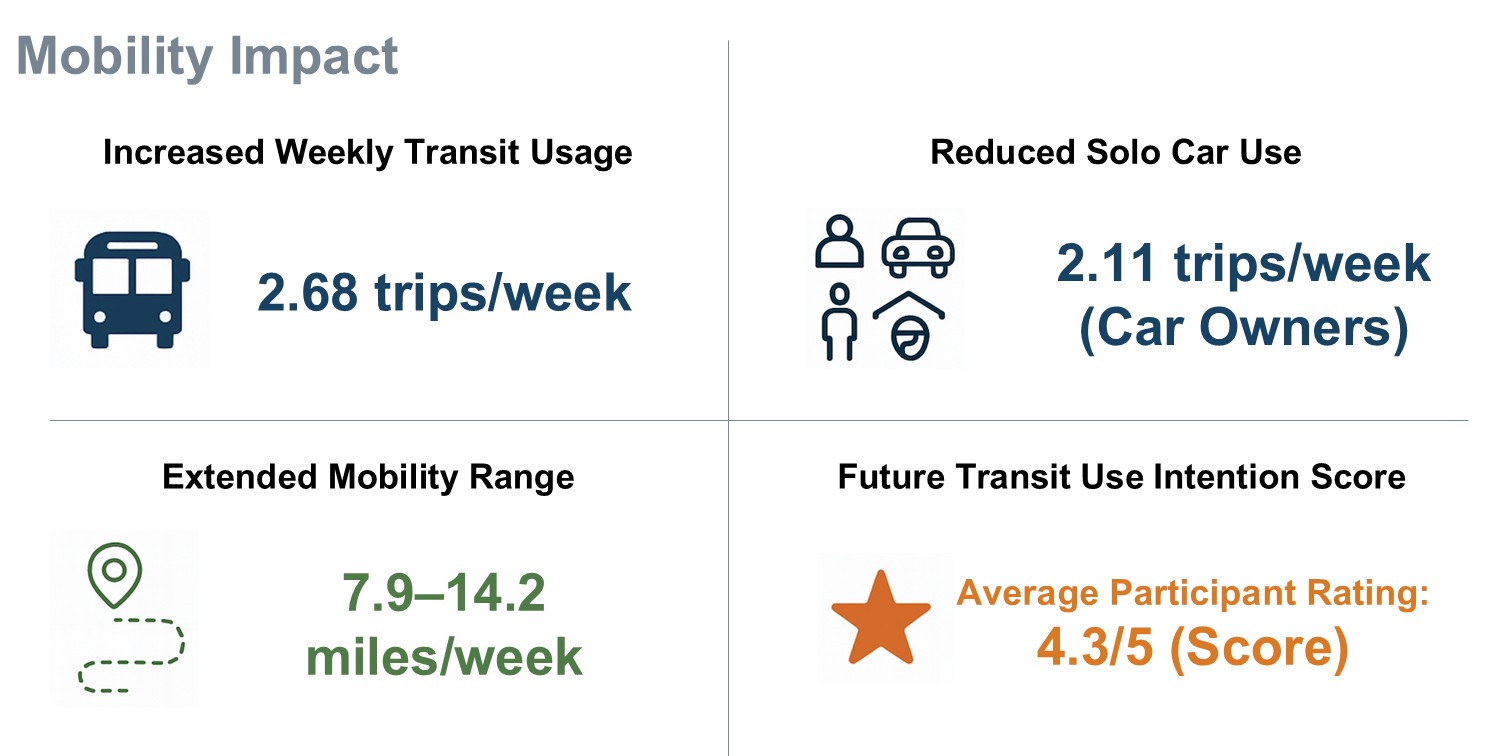
FTA EMI project (Villanova University and University of Maryland), 2023–2025; incenTrip was developed under the FHWA ATCMTD program.
Insight: unlike fixed subsidies, TECs reward measurable equity improvement and let agencies trade. The TEC price converges to an equilibrium, and inequality indices fall without sacrificing revenue.
- Wu, X., Liu, K., Zhen, D., Ji, Y.E., Cui, Q., Xiong, C. (2026). Tradable Equity Credits (TECs) for public transit: a dynamic pricing approach for heterogeneous travelers. Transportation Research Part E, 211, 104858. DOI
- Wu, X., Liu, K., Zhen, D., Ji, Y., Shang, X., Cui, Q., Xiong, C. (2025). Tradable Equity Credits (TECs) and internalised revenue maximisation: a nonlinear programming model for promoting equitable public transit services. Transportmetrica A: Transport Science. DOI
- Zhen, D., Wu, X., Liu, K., Ji, Y., Xiong, C., Cui, Q. (2026). Carbon credit in travel demand management: an incentive-based framework for emission reduction. Transportation Research Part D, 150, 105041. DOI
- Hu, S., Xiong, C., Ji, Y., Wu, X., Liu, K., Schonfeld, P. (2024). Understanding factors influencing user engagement in incentive-based travel demand management program. Transportation Research Part A, 186, 104145. DOI
1.2 Railway seat inventory control & ticket allocation
Railway seats are network resources shared by many OD products. Dynamic bid-price control decides, in real time, whether to sell a ticket, including transfer itineraries across trains.
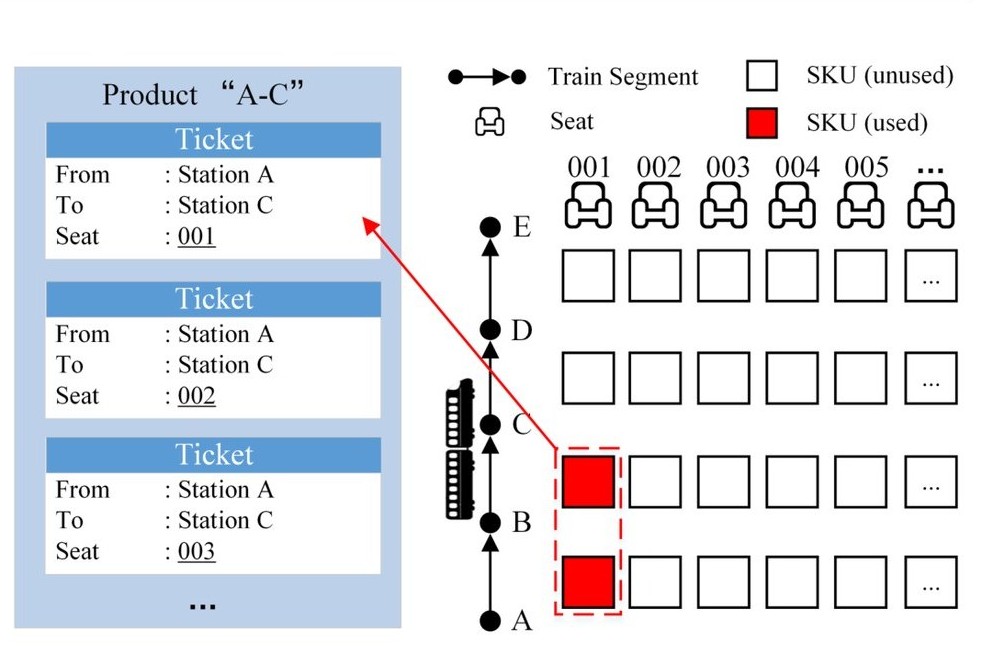
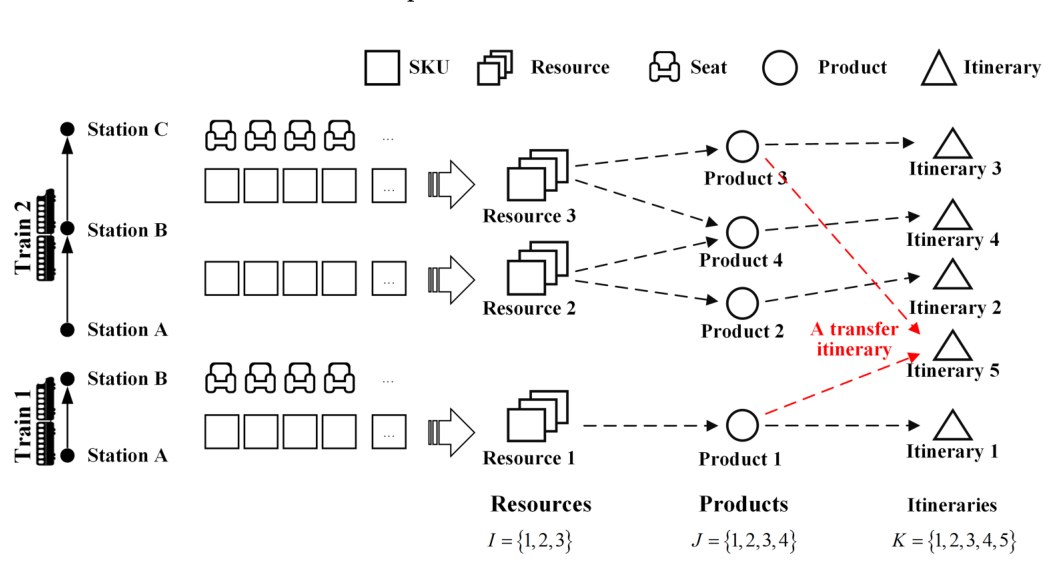
Yuan, Nie, Wu & Fu (2018), PLOS ONE.
- Yuan, W., Nie, L., Wu, X., Fu, H. (2018). A dynamic bid price approach for the seat inventory control problem in railway networks with consideration of passenger transfer. PLOS ONE, 13(8), e0201718. DOI
- Yuan, W., Nie, L., Wu, X. (2018). A dynamic bid price approach for the seat inventory control problem in high-speed railway networks considering passenger transfer service. TRB 97th Annual Meeting. TRID
- Yuan, W., Nie, L., Fu, H., Wu, X., Ke, Y. (2018). Simulation-based method for seat inventory control optimization under heterogeneous customer behavior: a case study of the China Railway. CICTP 2018, 788–798.
2. Railway Management
2.1 Railway network analysis
Treating the Chinese railway system as a weighted complex network reveals its scale-free degree distribution, the dominance of urban agglomerations, and a clear core–periphery structure, which provides the structural basis for demand, line and timetable planning.
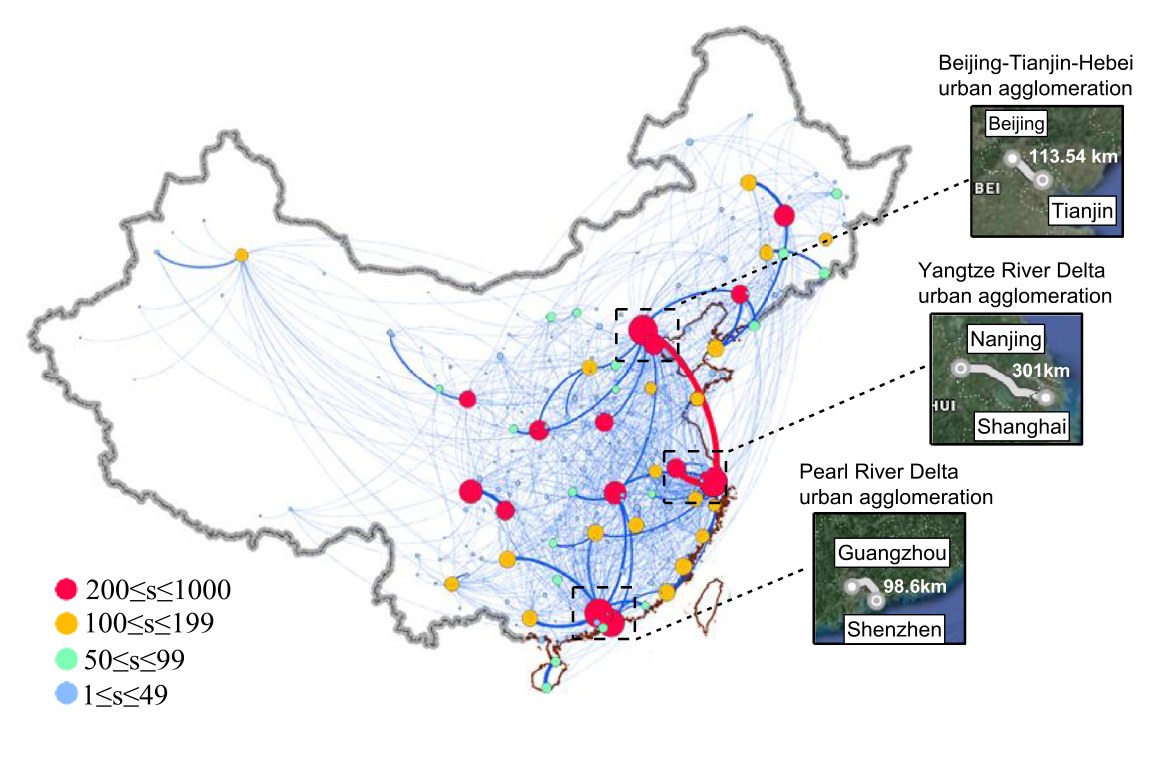
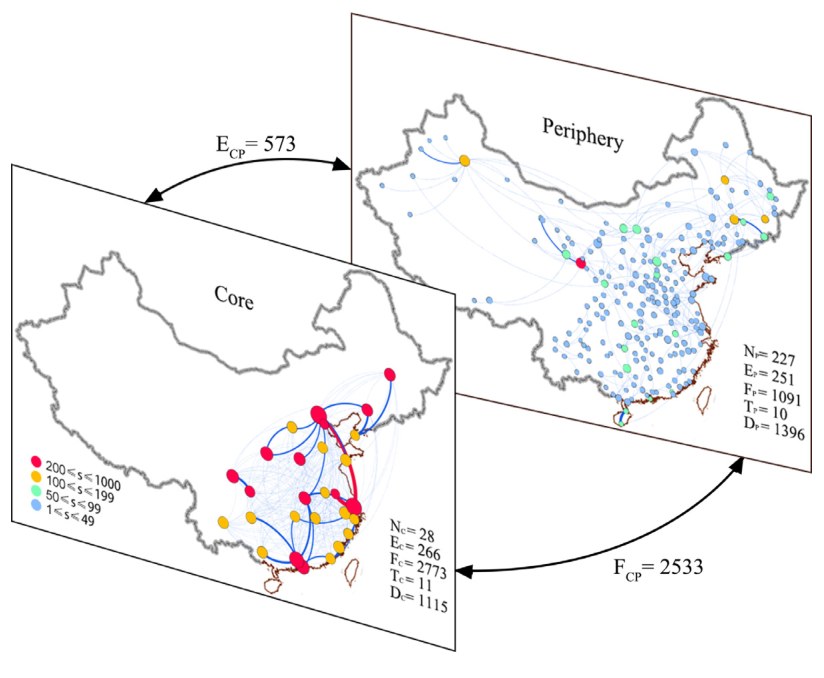
Wang, Cai, Du, Wu et al. (2020), Chaos, Solitons & Fractals: scale-free and core–periphery structure of the Chinese railway system.
- Wang, W., Cai, K., Du, W., Wu, X., Tong, L.C., Zhu, X., Cao, X. (2020). Analysis of the Chinese railway system as a complex network. Chaos, Solitons & Fractals, 130, 109408. DOI
2.2 Railway demand forecasting with AI computational graphs
Ridership changes for three reasons: diverted demand (travelers switch lines), induced demand (better service creates new trips), and ex-post demand (seat limits force second choices). A constrained computational graph estimates all three at once, together with boarding/alighting, OD trips and train-line loads.
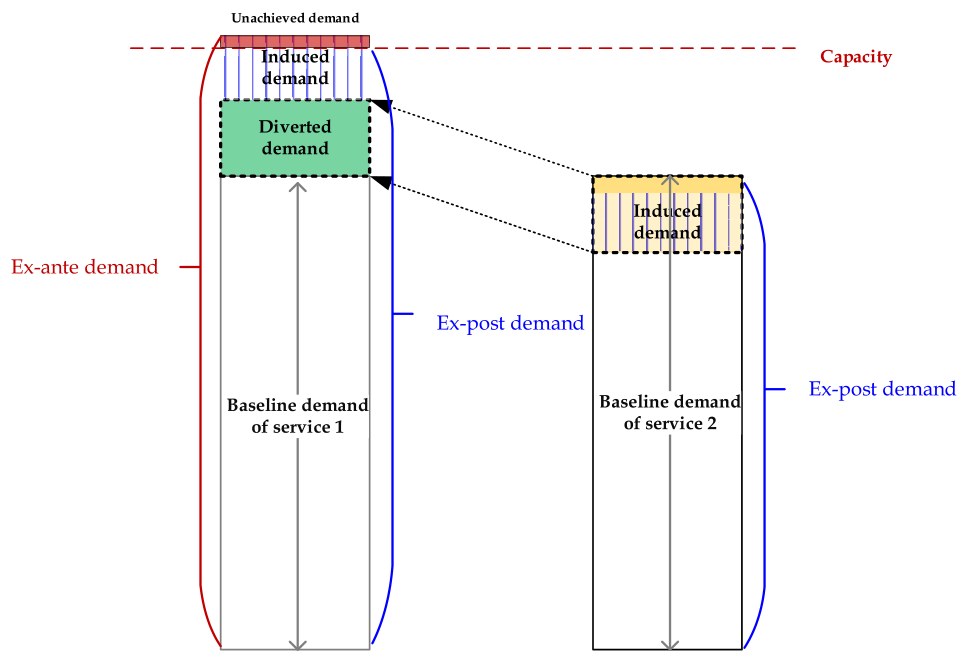
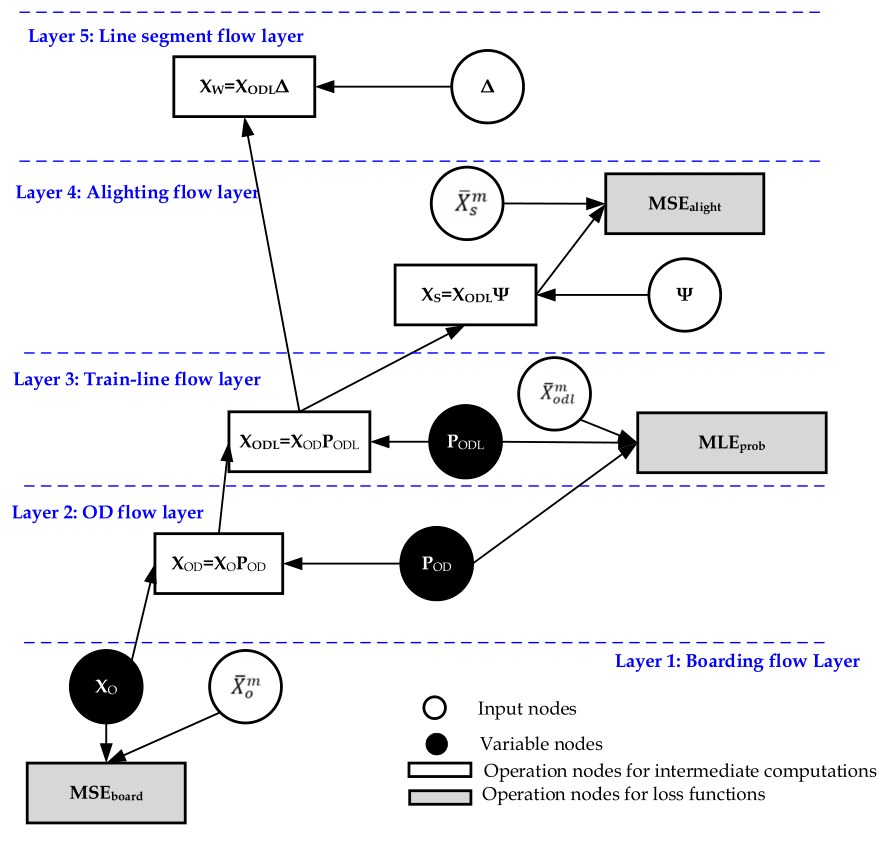
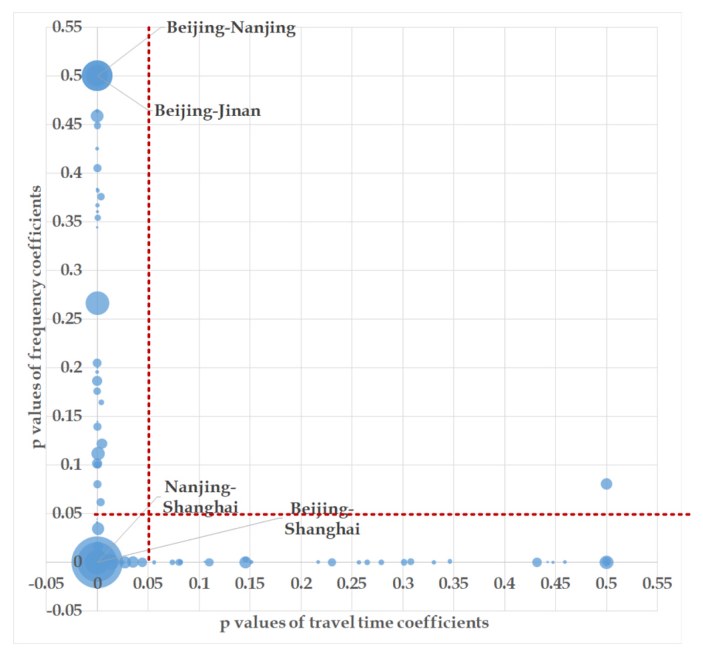
Wu, Wang, Kim, Saleh, Fu & Xiong (2025), Transportation Research Part E.
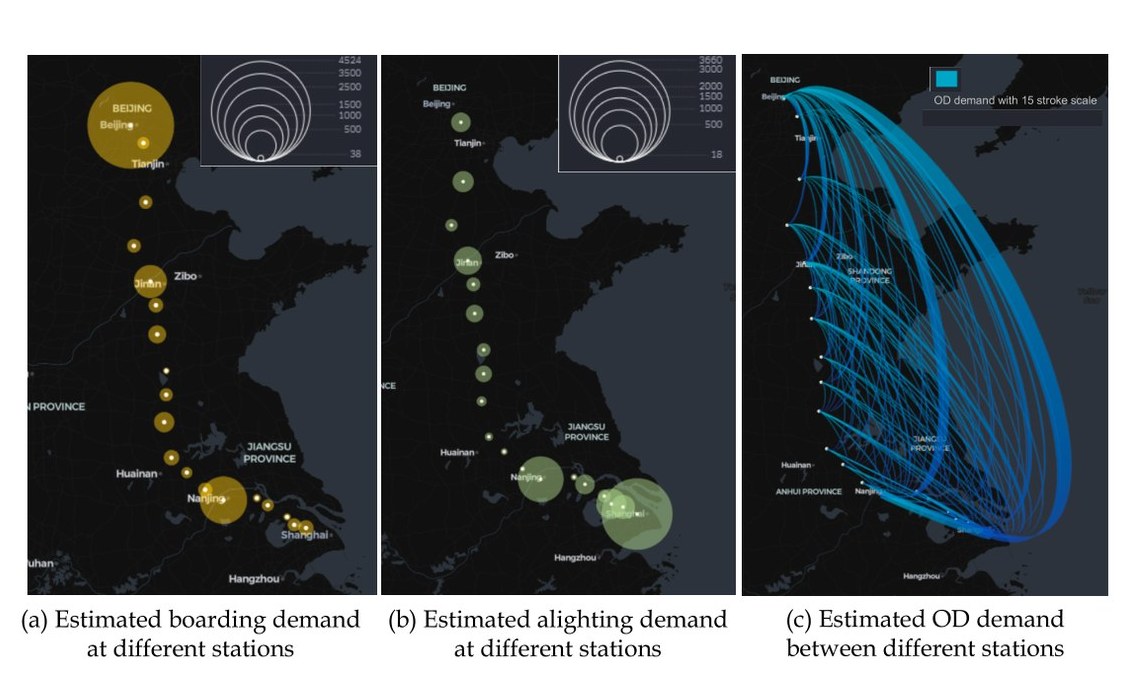
Insight: separating induced from diverted demand tells planners whether a new line grows the market or only reshuffles it, which is critical for line-plan and fare decisions.
- Wu, X., Wang, X., Kim, T., Saleh, K., Fu, H., Xiong, C. (2025). Simultaneous estimation of induced, diverted, and ex-post demand for railway passengers: an interpretable machine learning framework based on constrained computational graphs. Transportation Research Part E, 202, 104283. DOI
- Wang, X., Fu, H., Wu, X. (corresponding), Liu, Y., Kim, T. (2025). Multilayered railway passenger demand estimation considering nested choices: A computational graph-based learning framework. Urban Rail Transit, 11(3), 250–266. DOI
2.3 Line planning
Which trains run, and where do they stop? Line-planning models balance direct service for diverse OD demand against operating cost on large HSR networks, from daily to weekly plans.
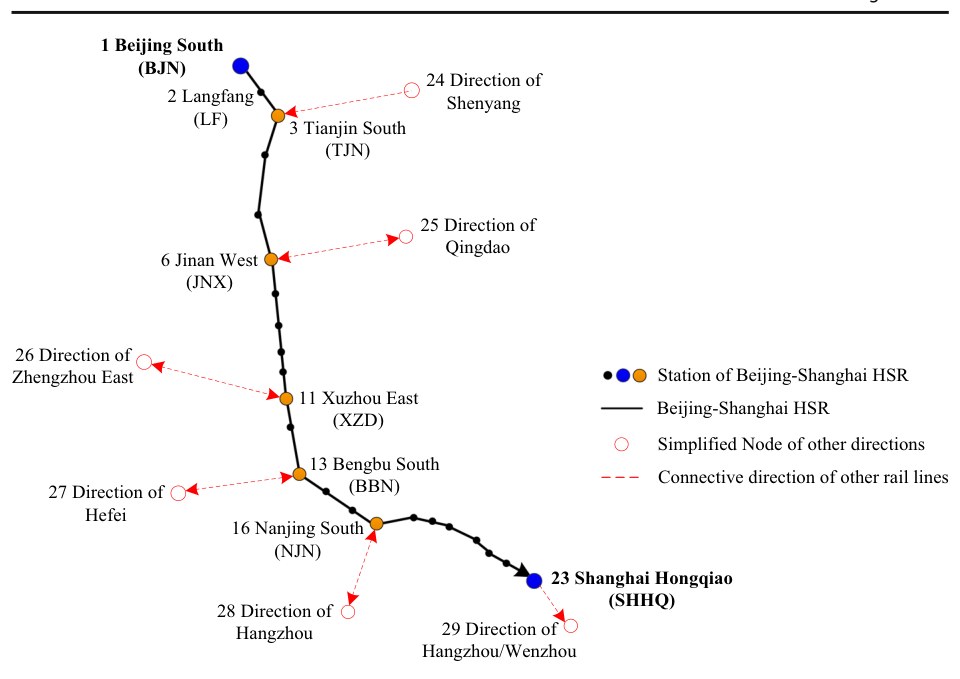
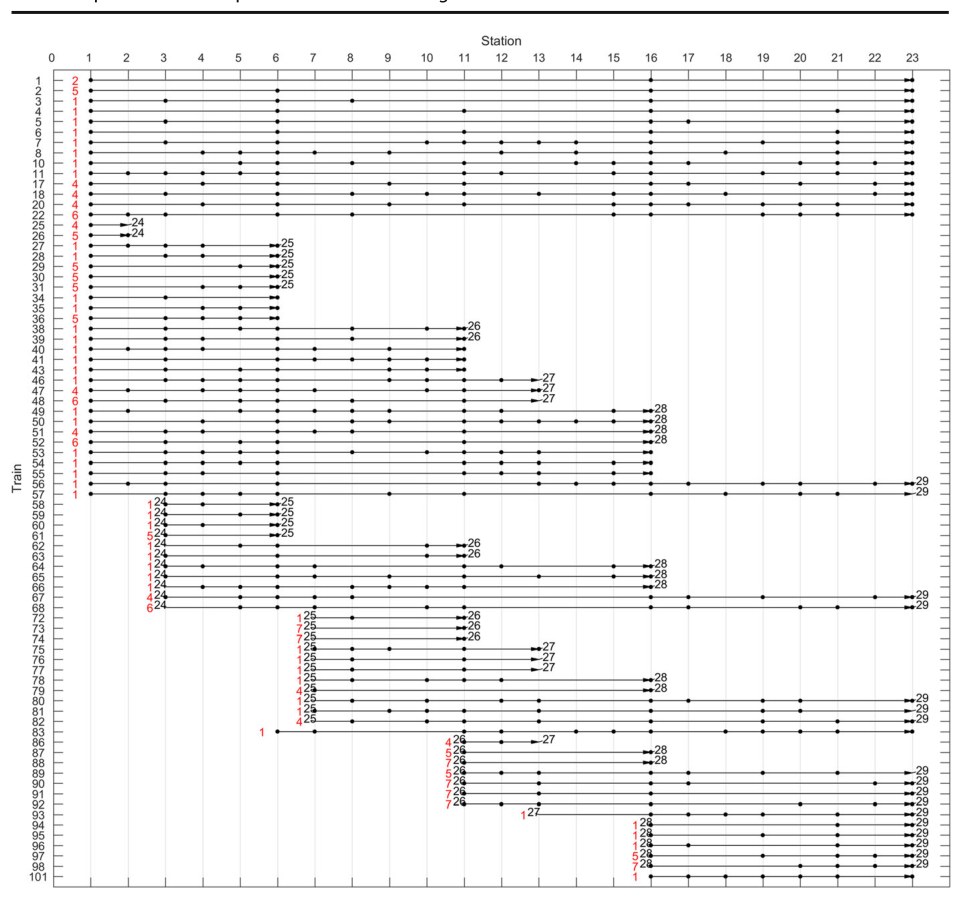
Zhang, Nie, Wu & Ke (2020), Networks and Spatial Economics: flexible stopping patterns on the Beijing–Shanghai HSR.
- Zhang, X., Nie, L., Wu, X., Ke, Y. (2020). How to optimize train stops under diverse passenger demand: a new line planning method for large-scale high-speed rail networks. Networks and Spatial Economics, 20(4), 963–988. DOI
- Nie, B., Nie, L., Fu, H., Wu, X. (2023). Weekly line planning to improve the match between rail supply and passenger demand. Computer-Aided Civil and Infrastructure Engineering, 38(13), 1810–1833. DOI
2.4 Timetabling & air–rail integration
Passengers connect from high-speed trains to flights through shuttle buses and walking. Integrated time–space network models synchronize train, aircraft, shuttle and passenger flows, solved by ADMM decomposition.
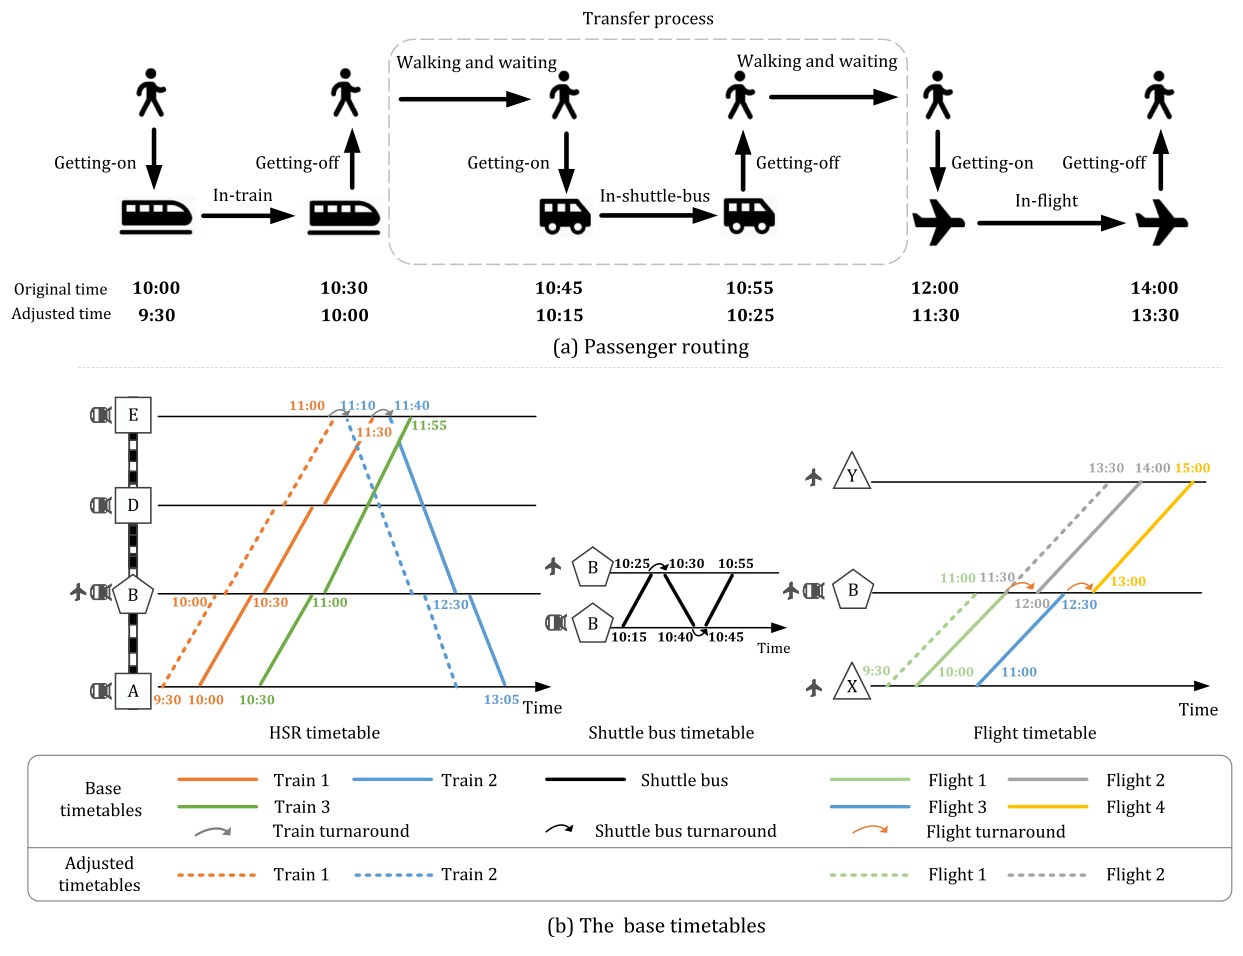
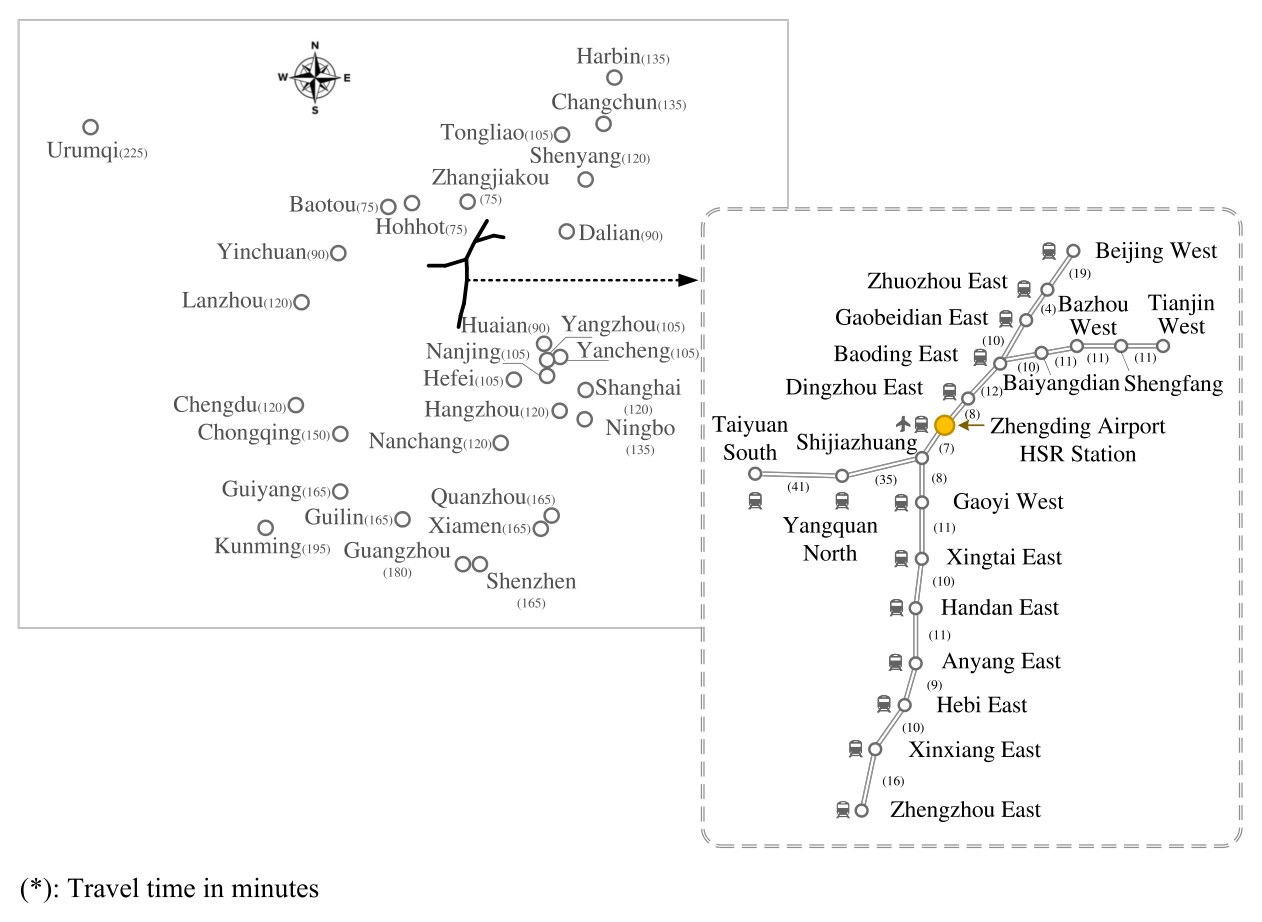
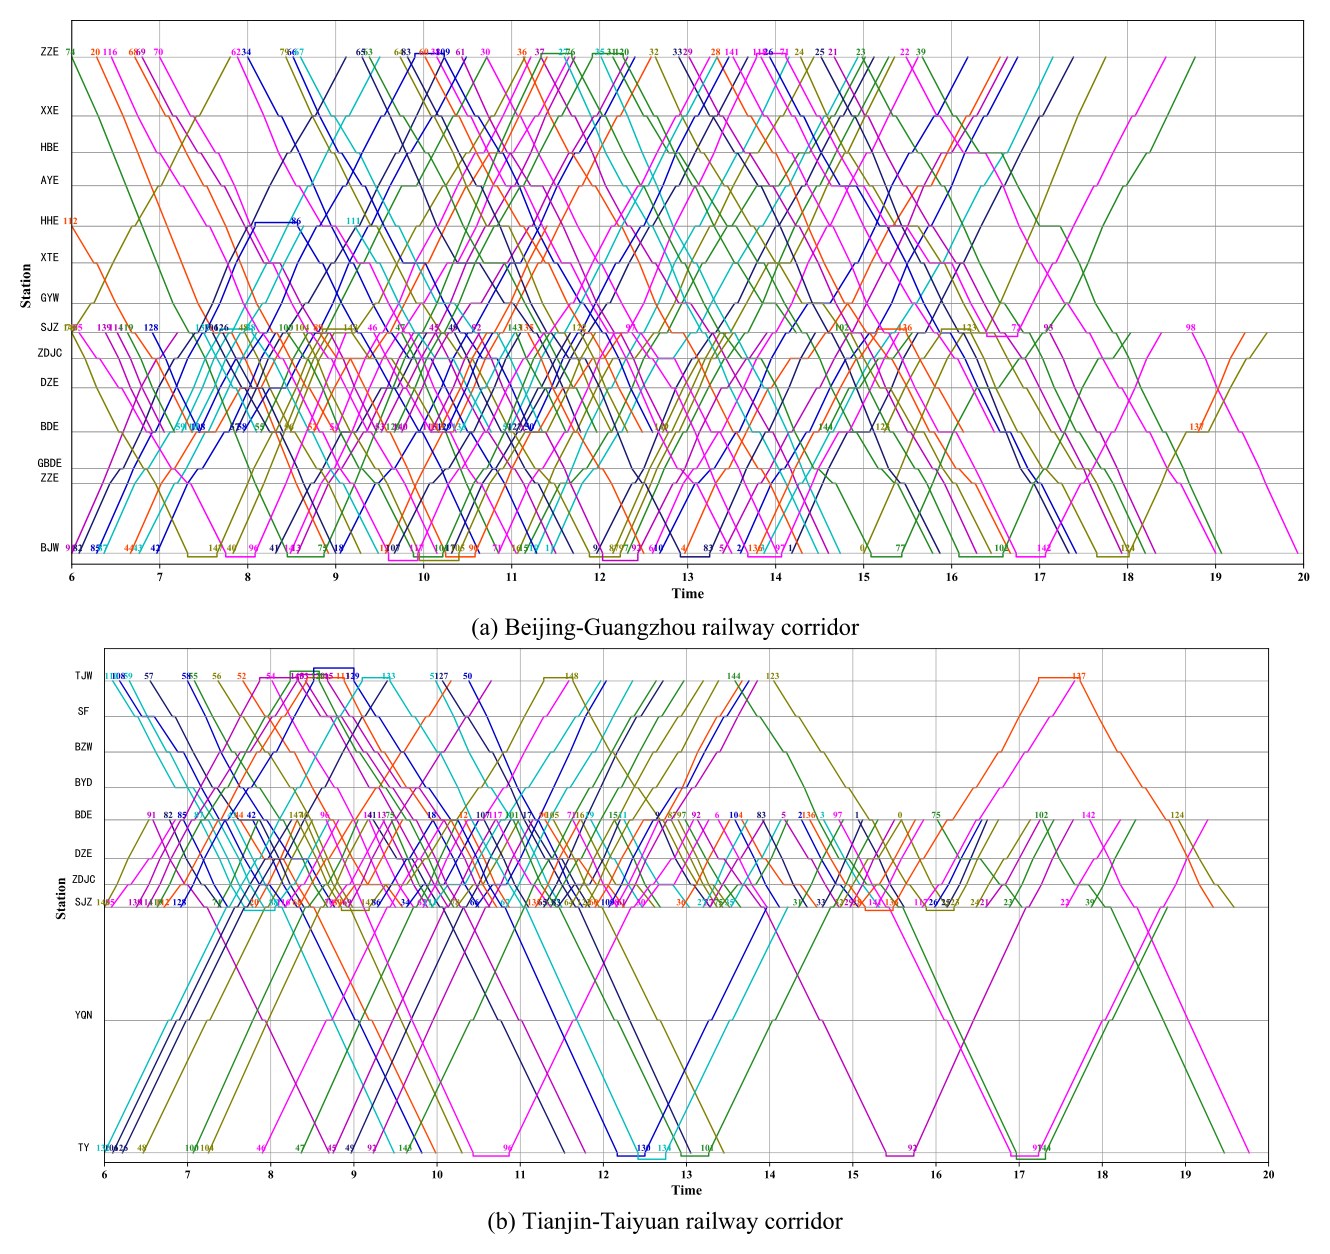
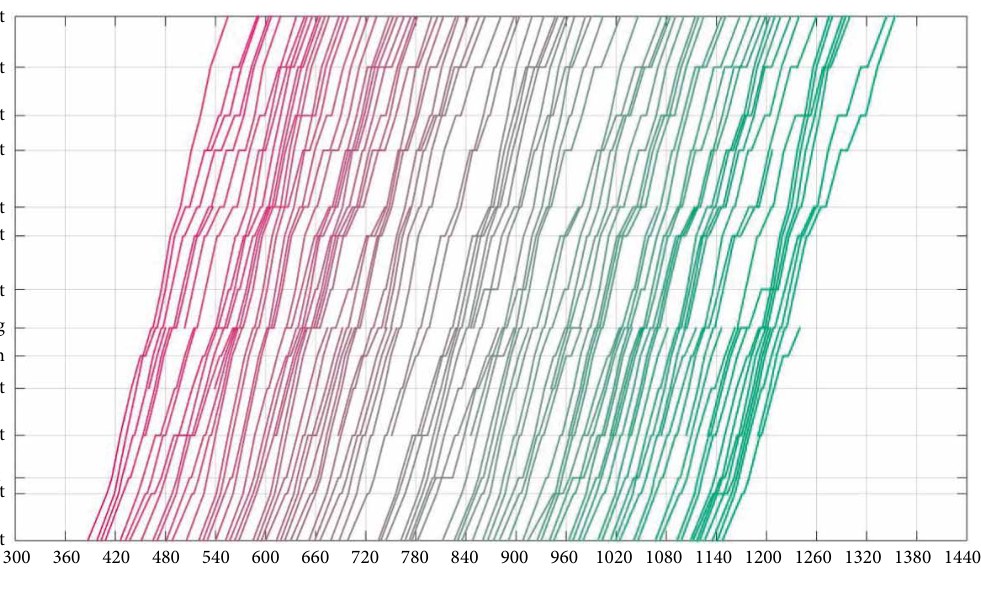
Ke, Wu, Nie, Yao & Chen (2024), TR-C; Ke, Nie, Liebchen, Yuan & Wu (2020), Journal of Advanced Transportation.
Insight: small, coordinated timetable shifts on rail produce many more valid air–rail connections; adding shuttle-bus capacity sharply reduces the number of unrouted passengers.
- Ke, Y., Wu, X., Nie, L., Yao, Z., Chen, Y. (2024). Synchronizing train, aircraft, shuttle, and passenger flows in intermodal timetabling: A time–space network-based formulation and a decomposition algorithm using ADMM. Transportation Research Part C, 159, 104464. DOI
- Ke, Y., Nie, L., Liebchen, C., Yuan, W., Wu, X. (2020). Improving synchronization in an air and high-speed rail integration service via adjusting a rail timetable: A real-world case study in China. Journal of Advanced Transportation, 2020, 5081315. DOI
2.5 Urban air mobility (UAM) + high-speed rail (new, 2026)
Electric VTOL air taxis can feed HSR stations. A hub-and-spoke network design model assigns vertiports to stations via a semi-quadratic assignment formulation, made tractable by exploiting the special UAM–HSR network structure in its linearization.
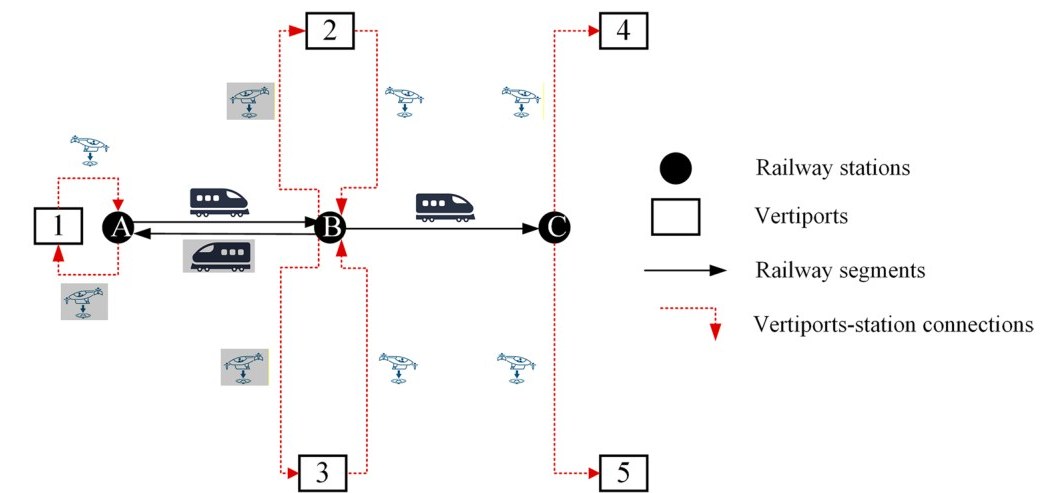
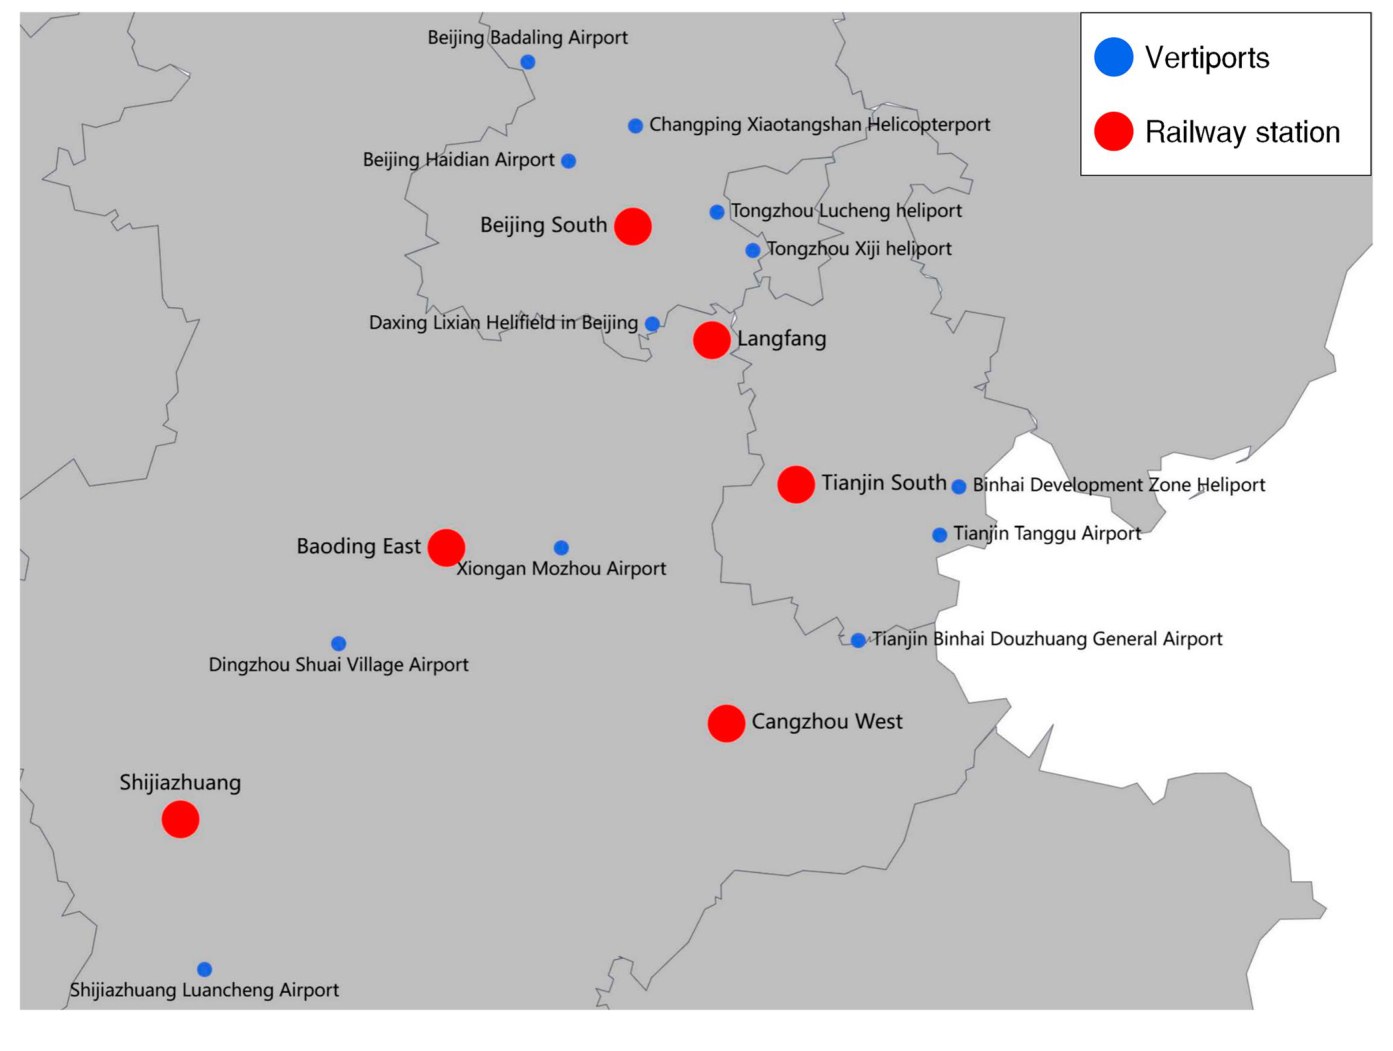
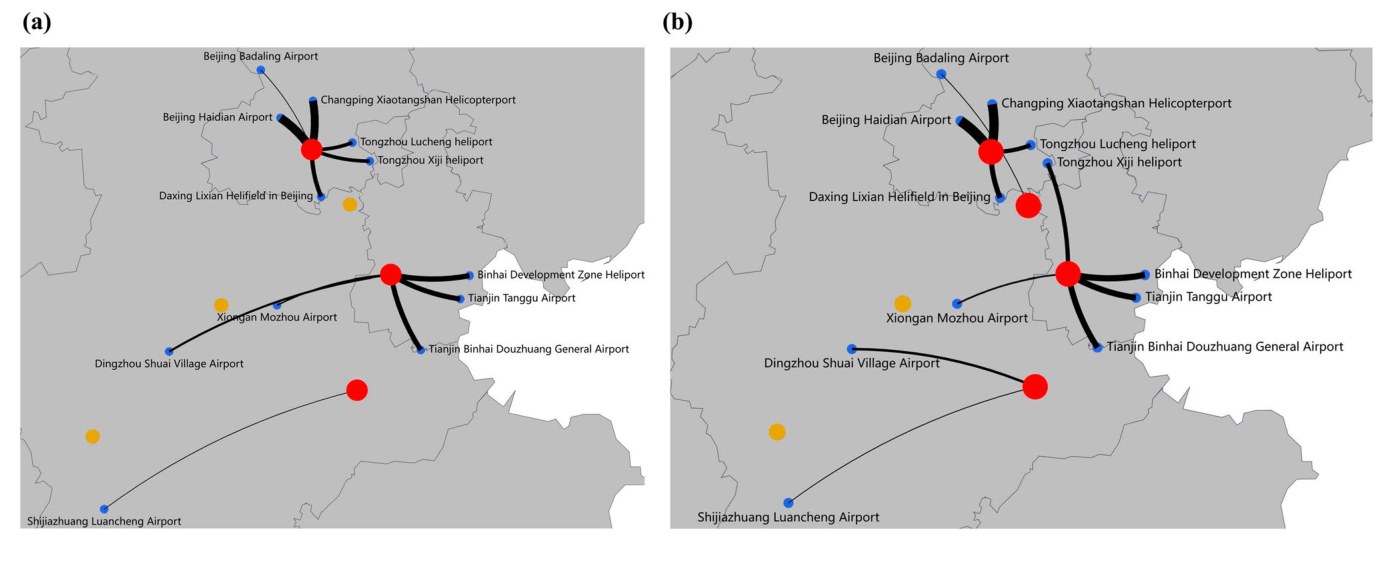
Wu, Huo, Wen & Xing (2026), Urban Rail Transit: case studies in the Beijing–Tianjin–Hebei and Yangtze River Delta regions.
- Wu, X., Huo, Y., Wen, Y., Xing, J. (2026). Multimodal hub-and-spoke network design problems to integrate urban air mobility and high-speed rail services: A semi-quadratic assignment formulation and its linearization. Urban Rail Transit. DOI
Figures are reproduced from the author’s own publications for scholarly, non-commercial illustration; please cite the original articles.