
One idea runs through this work: treat a transportation system as a differentiable computational graph, so that classic travel-behavior and traffic-flow theory can be learned directly from big data, while every parameter keeps its physical and economic meaning.
At a glance: (1) interpretable AI in transportation modeling: computational-graph travel demand learning & economic analysis, interpretable traffic state estimation · (2) emerging data: LBS, climate and health data in the U.S., Nigeria and South Africa · (3) transportation multi-resolution modeling (MRM) & world models.
Real-World Case Studies at Scale
| City / region | Network and data | Scale | Papers |
|---|---|---|---|
| Los Angeles, CA | Caltrans District 7 freeway sensors (PeMS); I-405 bottleneck | 150 sensors network-wide; 22 detectors on a 6-mile corridor, 4 months | Shao, Wu et al. 2025 TR-C; Zhou et al. 2022; Cheng et al. 2022 |
| Beijing, China | Regional travel demand subnetwork (Beijing Transport Institute data); West 3rd Ring Road freeway bottleneck | 2,502 nodes · 5,397 links · 236 zones · 14,967 OD pairs · 40,494 paths | Wu et al. 2018 TR-C; Sun et al. 2019 Sensors; Cheng et al. 2022 TR-C |
| Phoenix (Maricopa County), AZ | MAG regional travel demand model; ADOT freeway detectors on I-10 | 21,945 nodes · 52,846 directional links; I-10 corridor, 365 days of 2016 | Wu et al. 2021 TRB; Belezamo, Wu et al. 2019 IEEE ITSC; Zhou, Cheng, Wu et al. 2022 Multimodal Transportation |
| Melbourne, Australia | Large urban network with regular, POI and stadium-event days | 2,077 nodes · 4,223 links · 416 centroids · 24,160 OD pairs | Shao, Wu et al. (under review, 2026) |
| Lagos State, Nigeria | Mobile-device LBS sightings, Sentinel-1 flood imagery, serology data | 6.67 billion sightings → about 13 million OD trips; 5,367 geohash cells across 20 LGAs | Zhang et al. 2026 IJDRR; Liu, Wu et al. (under review, 2026) |
| New York, NY | Midtown Manhattan – JFK Airport corridor | Freeway bottleneck queue analysis | Cheng et al. 2022 TR-C |
| Louisiana & Texas (U.S. Gulf Coast) | Hurricane Laura (2020): mobile-device LBS data, evacuation orders, COVID-19 cases | County-level daily panel across the affected region | Liu, Wu et al. 2025 JTG |
| South Africa | Inter-regional travel and SARS-CoV-2 variants: mobile-phone sightings | 9 provinces · 52 districts | Luo, Wu et al. 2025 PLOS ONE |
| 7 African countries | Mobility and non-communicable diseases (diabetes, CVD): ongoing NIH pilot | Nigeria, South Africa, Ghana, Botswana, Gabon, Congo, Ethiopia | Ongoing |
1. Interpretable AI in Transportation Modeling
Deep learning predicts well but rarely explains. My approach to interpretable AI builds the network from transportation theory: each layer of a computational graph is a modeling step, and each learned weight is a behavioral, economic or physical parameter. The models train like deep learning, yet every output can be read and explained.
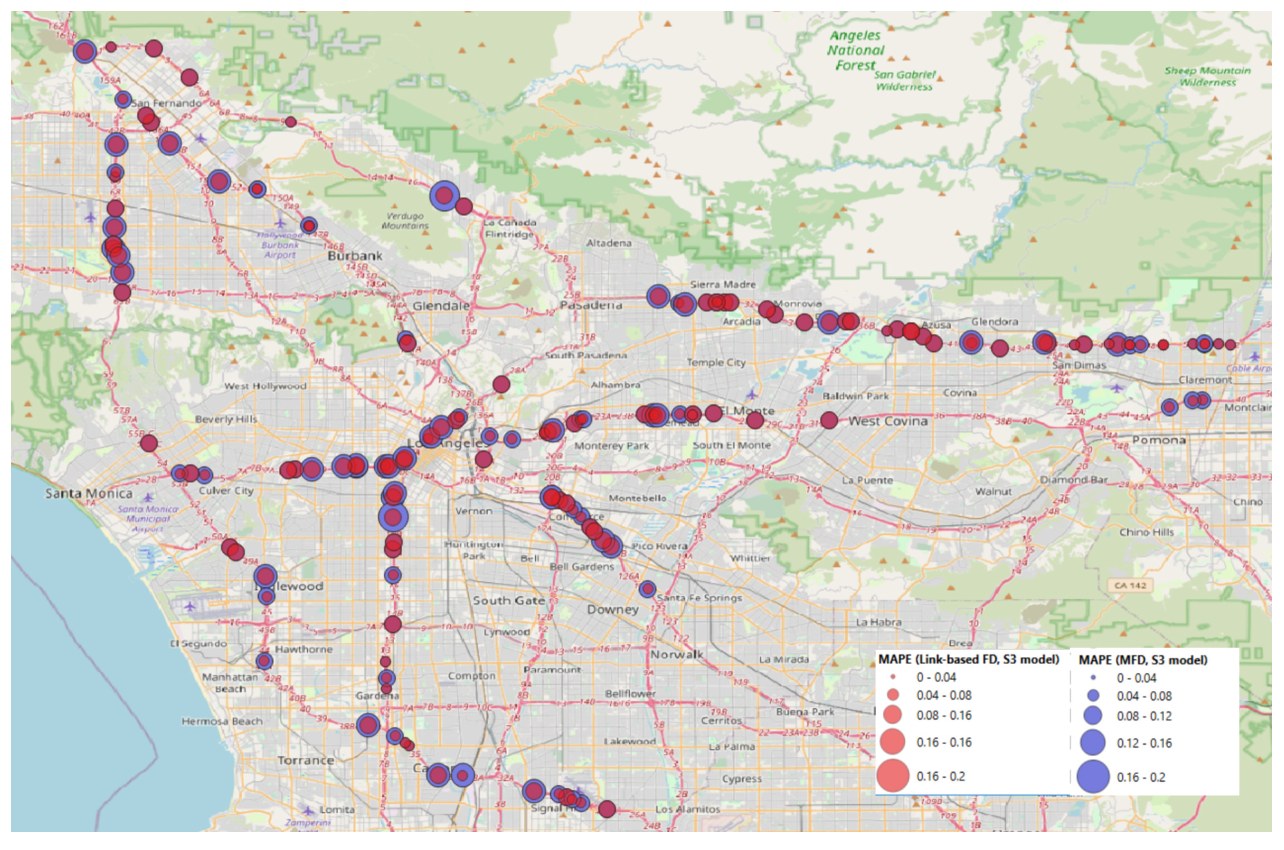
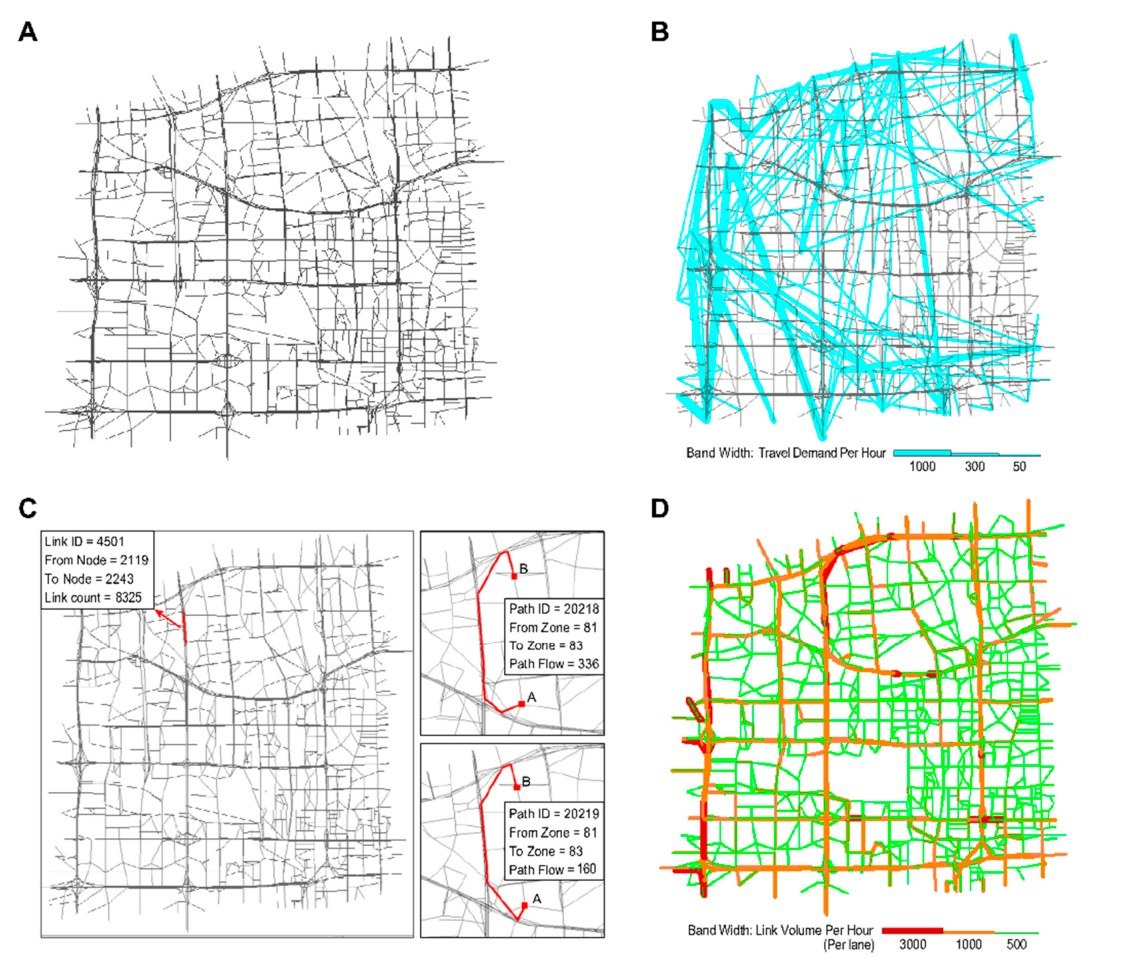
Shao, Shao, Wu, Cheng & Lam (2025), TR-C; Sun, Guo, Wu et al. (2019), Sensors.
1.1 Computational-graph travel demand learning & economic analysis
The classic four-step model (trip generation → distribution → route/line choice → assignment) is rebuilt as a layered computational graph. Forward propagation reproduces the model; backpropagation calibrates all layers at once against household surveys, mobile-phone data, floating-car data and link counts.
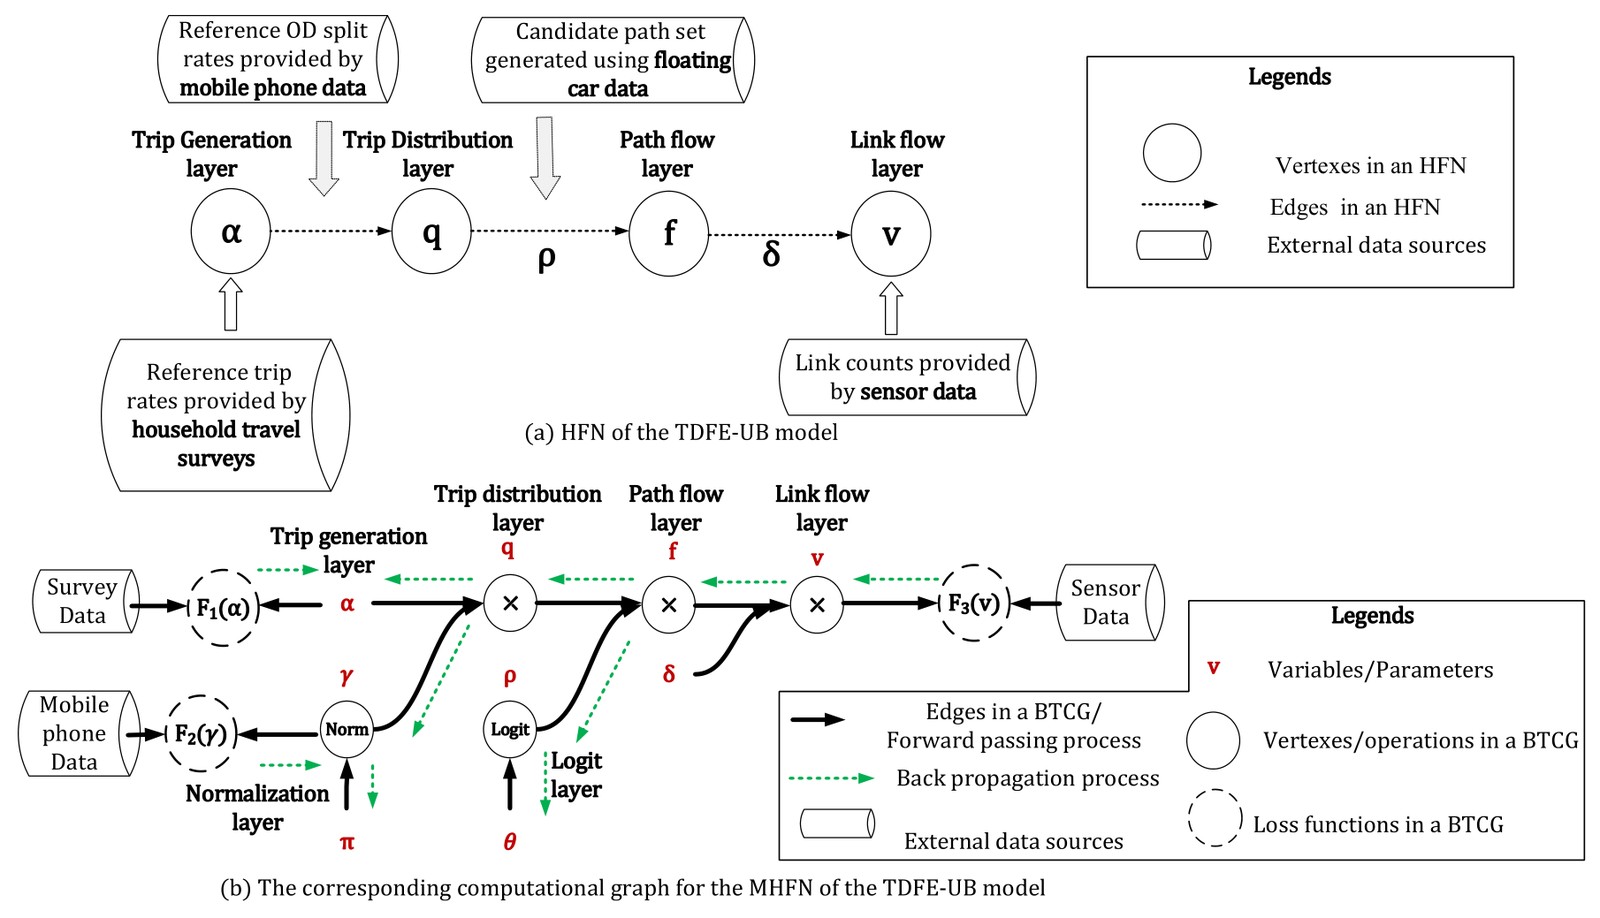
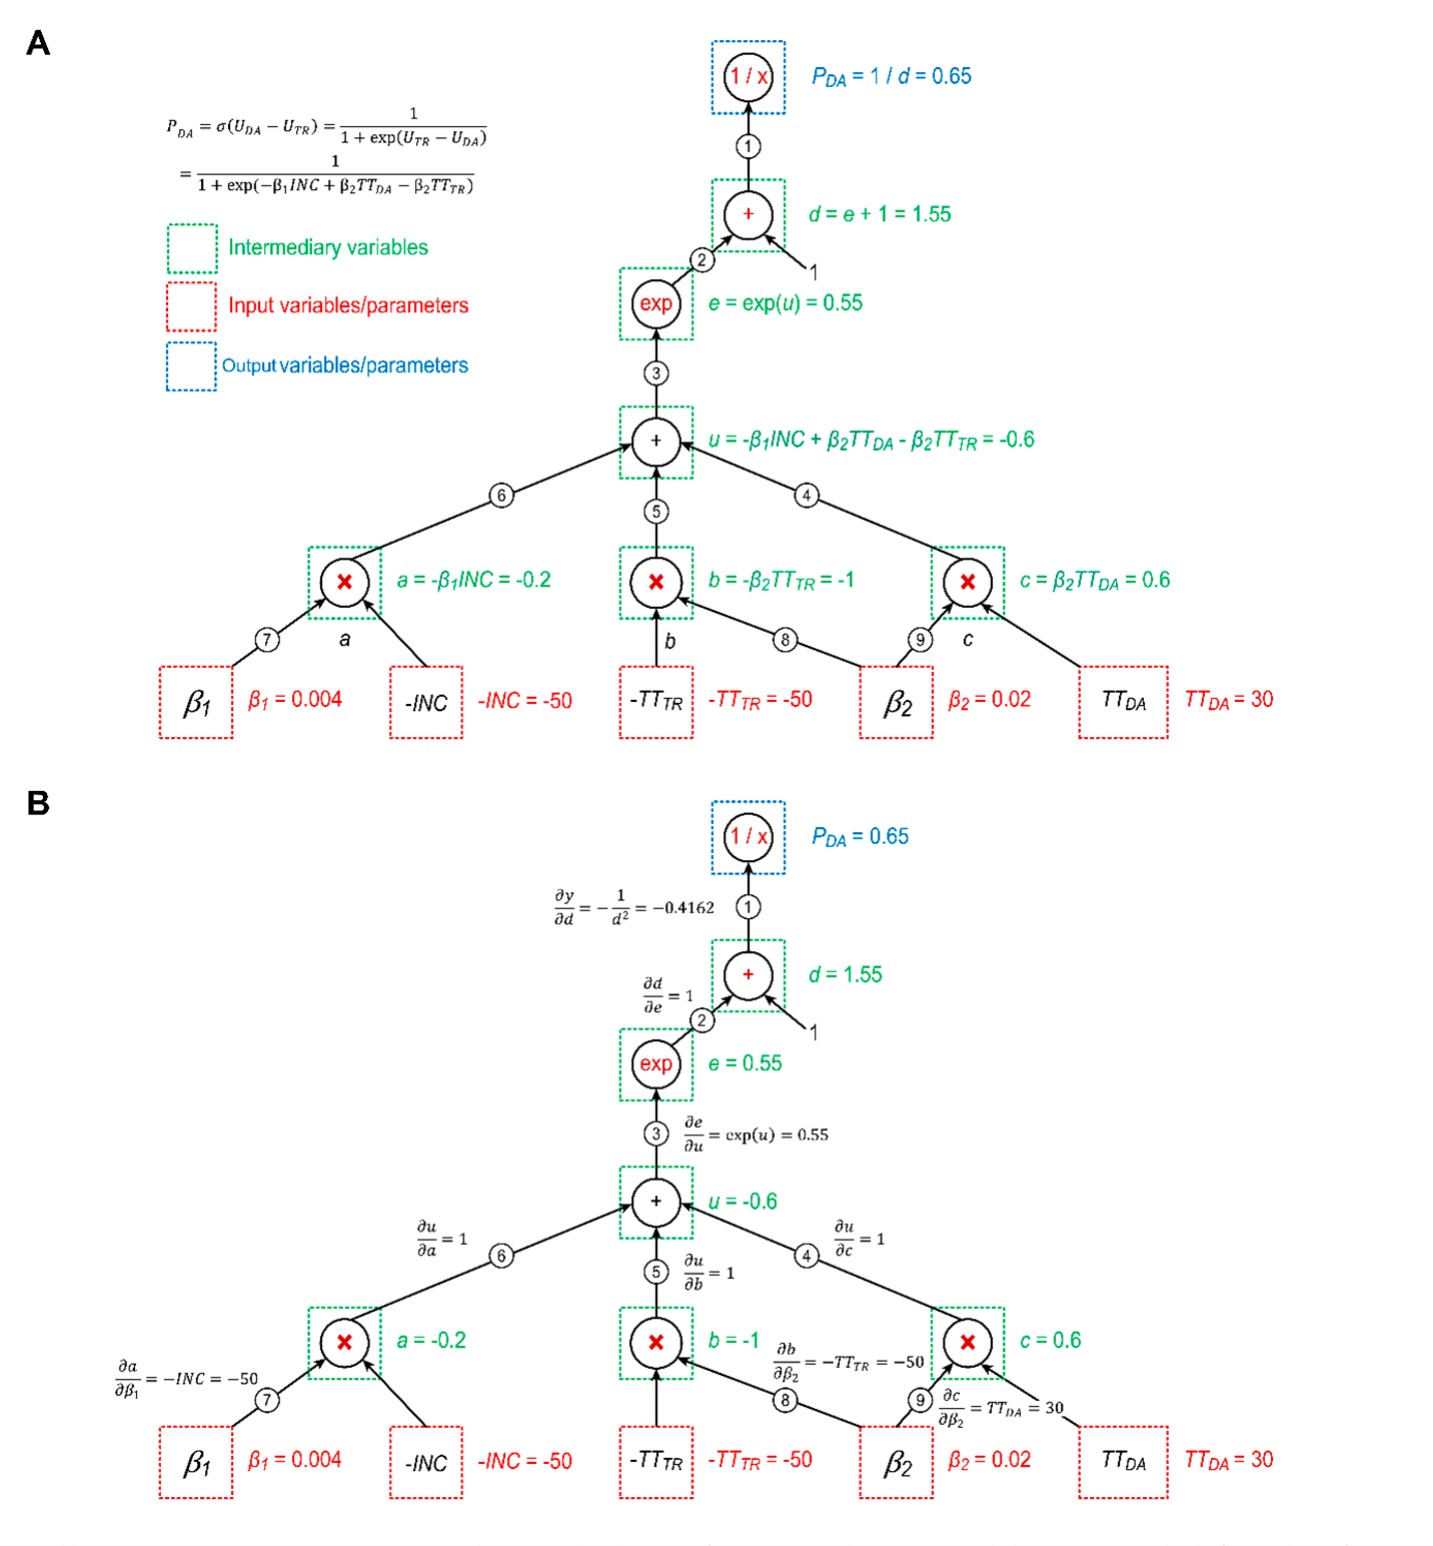
(a) Wu, Guo, Xian & Zhou (2018), Transportation Research Part C; (b) Sun, Guo, Wu et al. (2019), Sensors.
The same graph supports economic analysis: each policy is a lever on a node of the graph, and its marginal effect on link flows and travel time follows directly from the gradients, e.g., pricing, workplace relocation, population transfer, and mode shift.
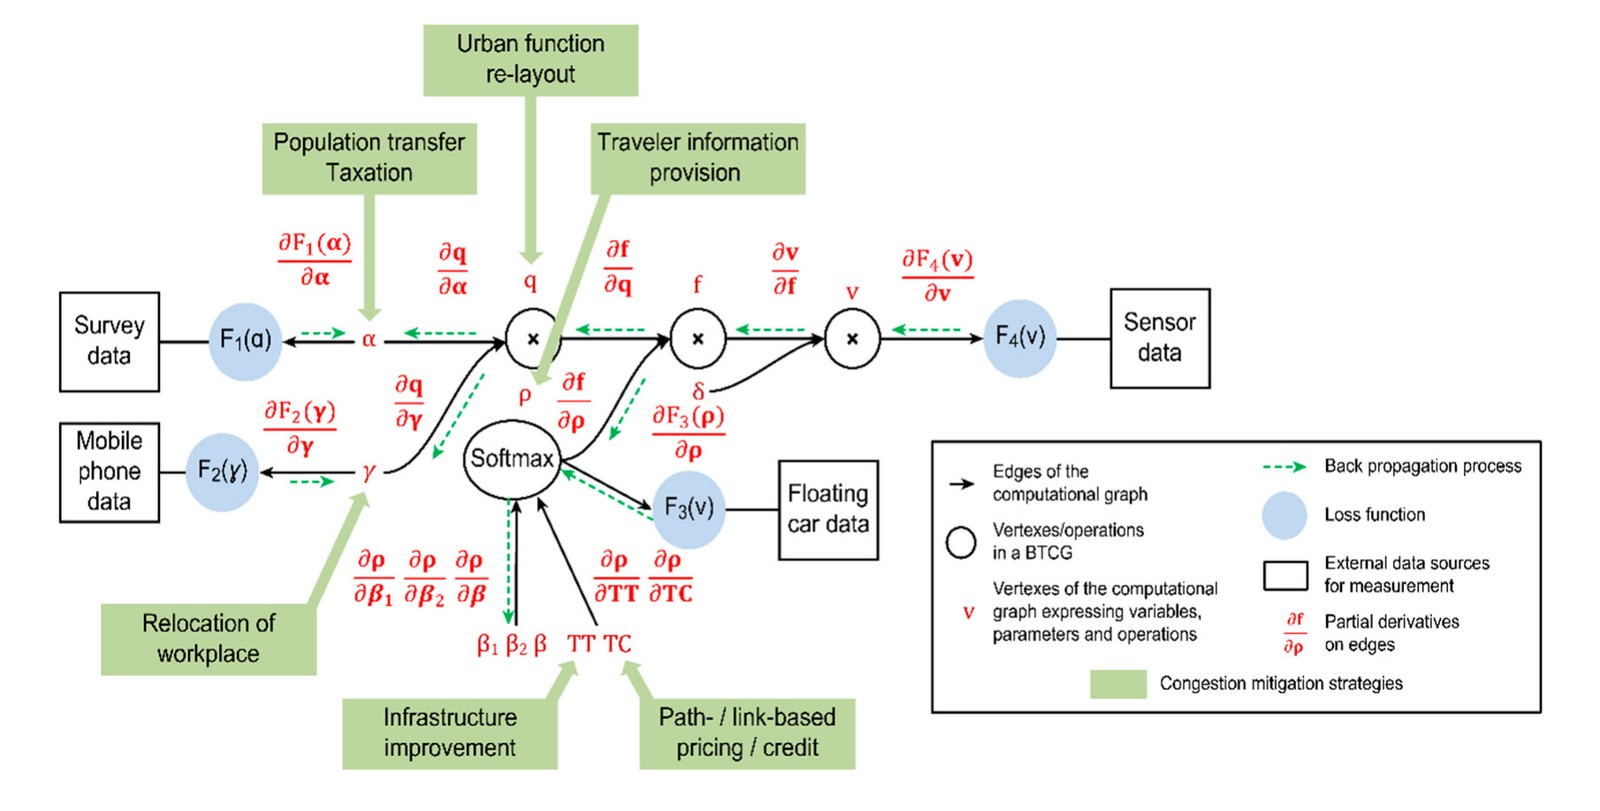
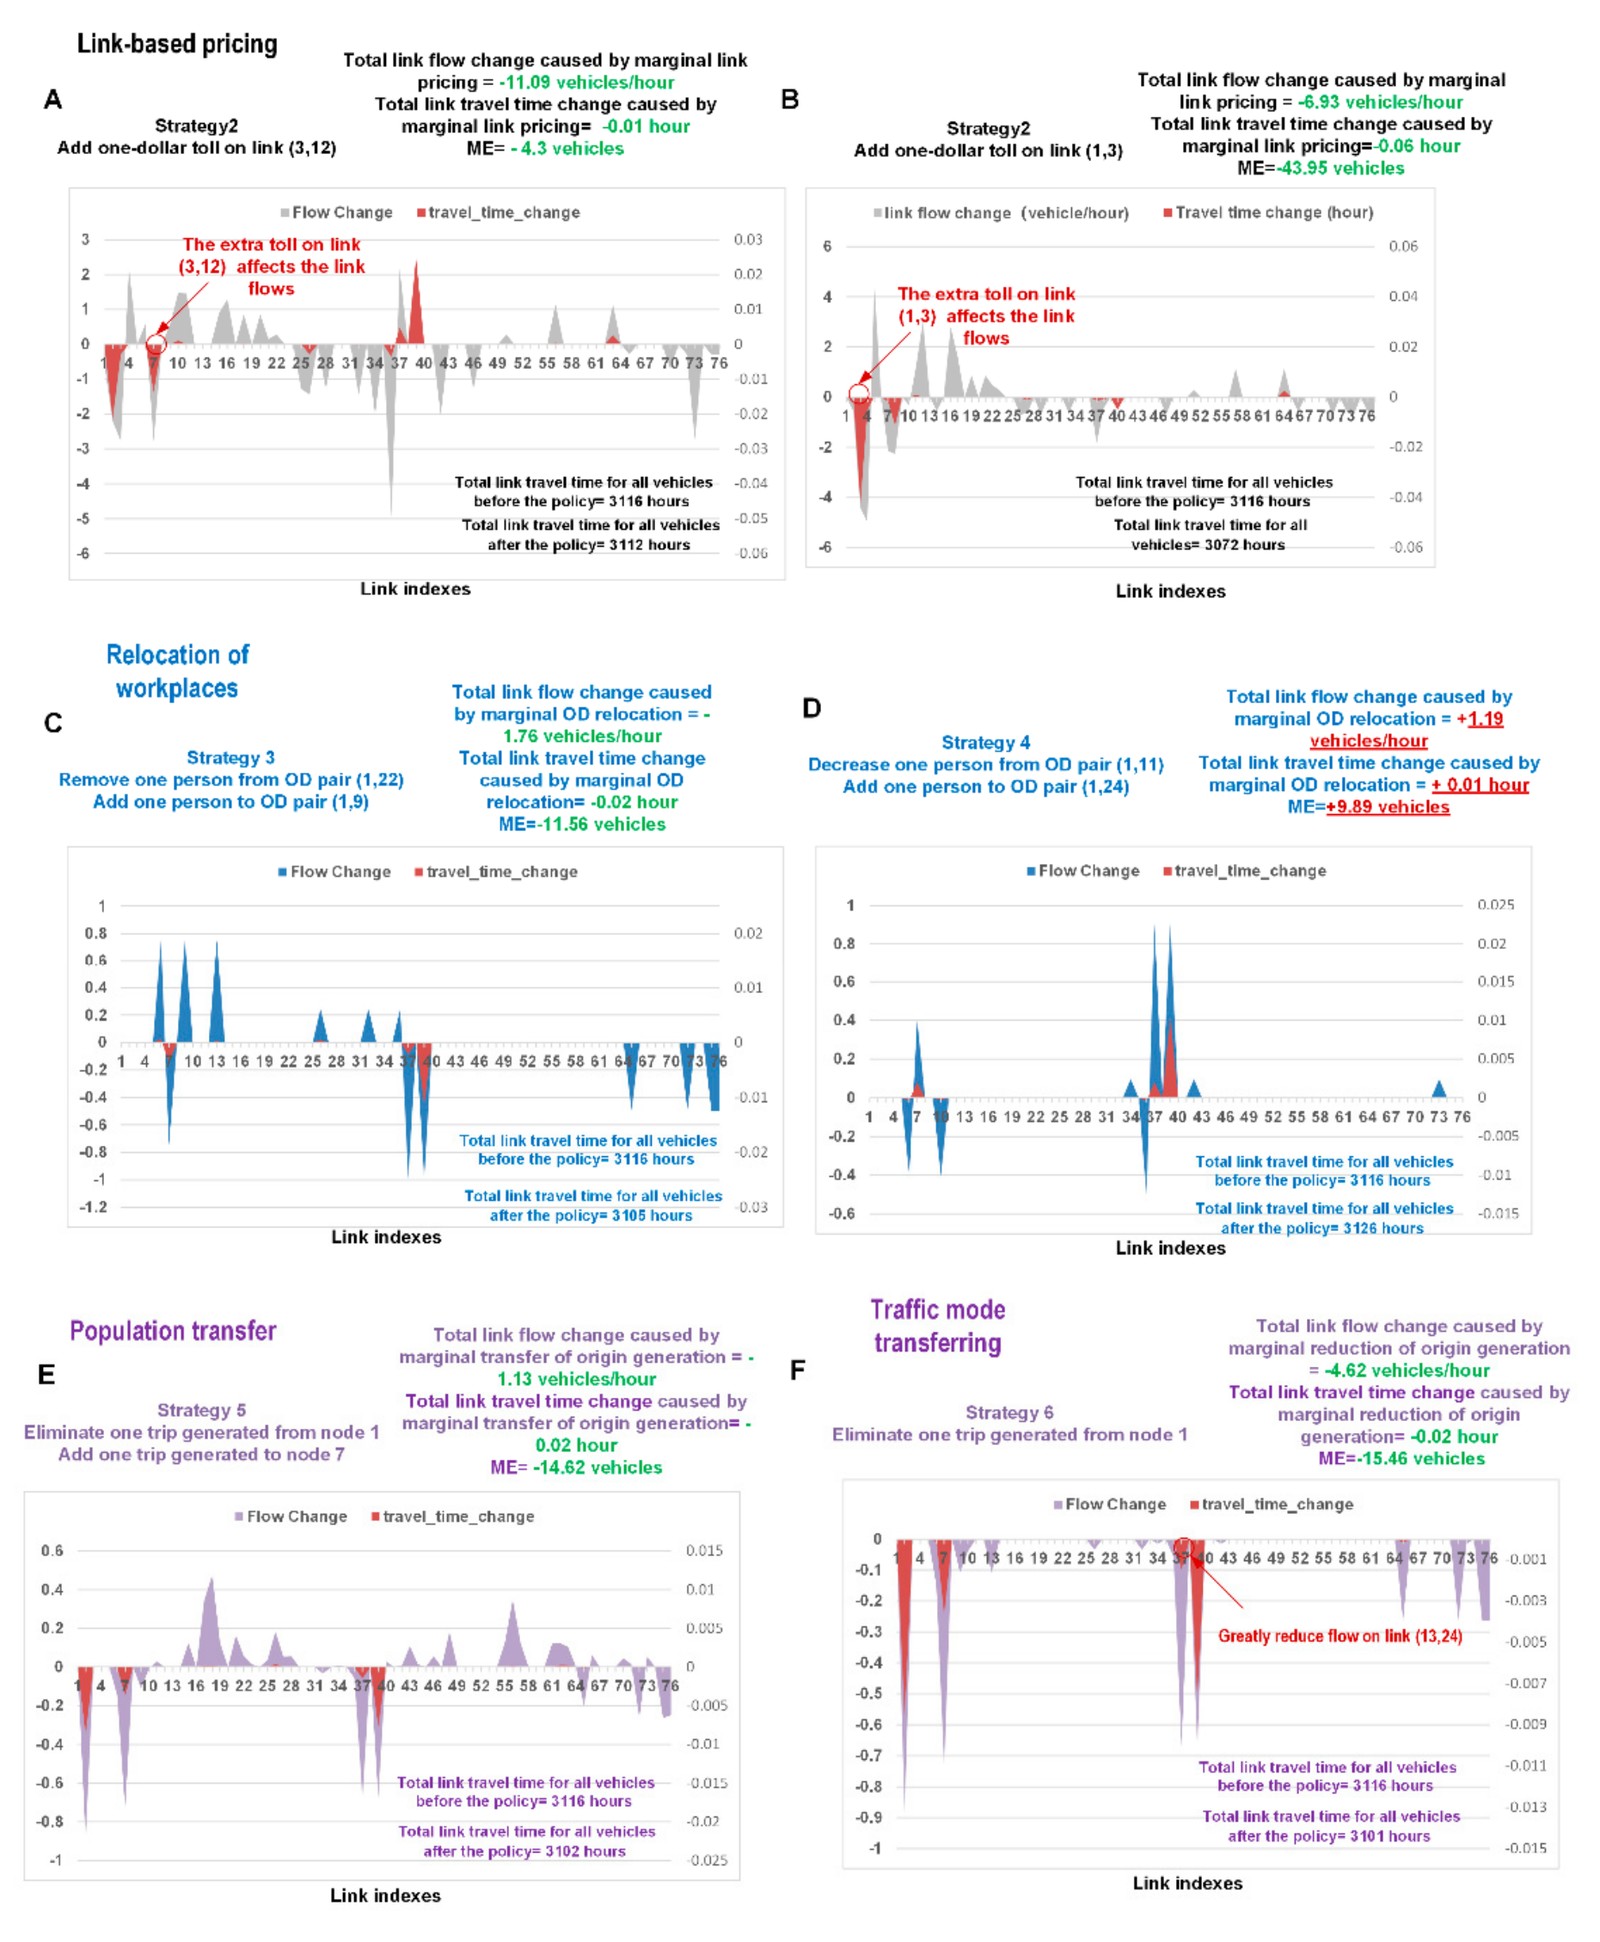
Sun, Guo, Wu, Zhu, Wu, Xian & Zhou (2019), Sensors.
New (under review): Melbourne, Australia. Daily traffic mixes regular commuting, major events and tourist attractions. A computational-graph model learns these contexts from data on the full Melbourne network, including days with POI activities and stadium events, and recovers the value of time within 3% of its benchmark.
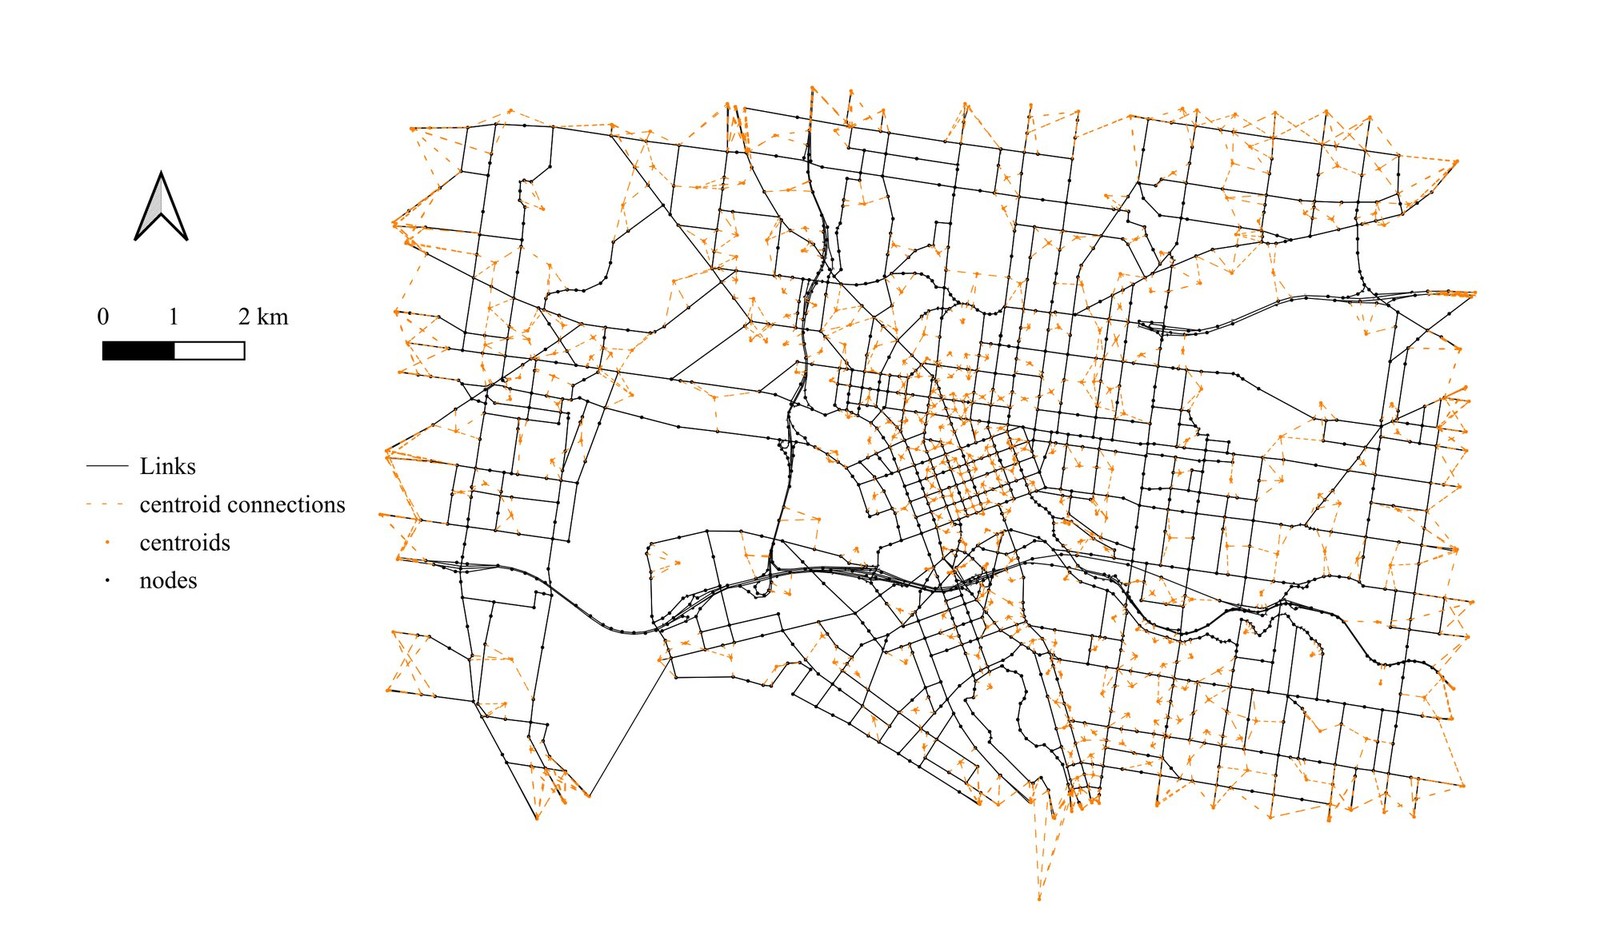
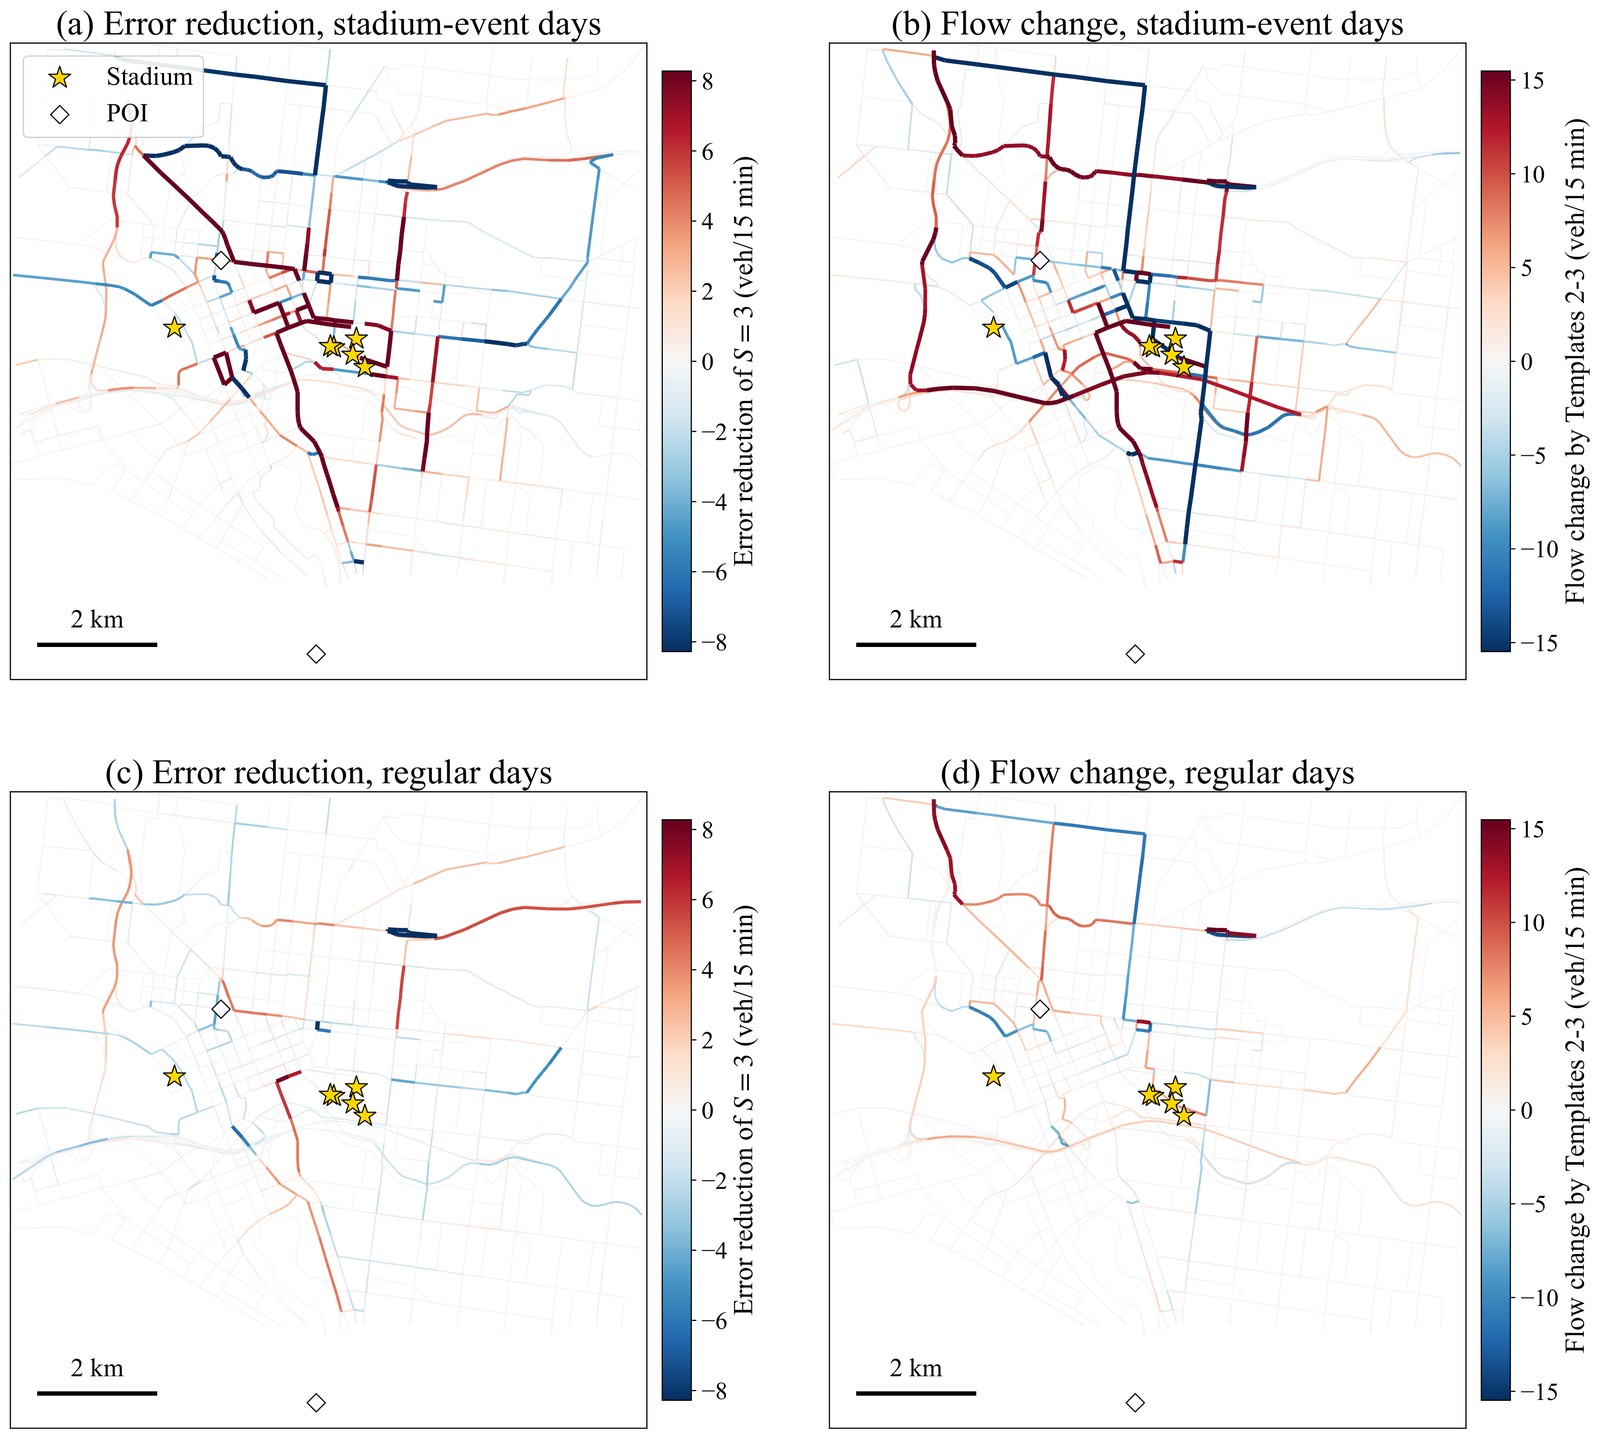
Shao, Wu (corresponding), Zhao, Shao & Lam, manuscript under review (2026).
Insight: interpretability comes from where theory sits in the graph. Agencies can ask “what if” questions with the same model that fits the data.
- Wu, X., Guo, J., Xian, K., Zhou, X. (2018). Hierarchical travel demand estimation using multiple data sources: A forward and backward propagation algorithmic framework on a layered computational graph. Transportation Research Part C, 96, 321–346. DOI
- Sun, J., Guo, J., Wu, X. (corresponding), Zhu, Q., Wu, D., Xian, K., Zhou, X. (2019). Analyzing the impact of traffic congestion mitigation: from an explainable neural network learning framework to marginal effect analyses. Sensors, 19(10), 2254. DOI
1.2 Computational-graph-based interpretable traffic state estimation
Sparse, heterogeneous sensors (loop detectors, probe vehicles, Bluetooth, video) are fused into a continuous space–time traffic state. Traffic-flow physics, such as fluid queue models and the calibratable S-shaped three-parameter (S3) traffic stream model, is embedded in the network, so estimates and predictions stay physically meaningful even with missing data.
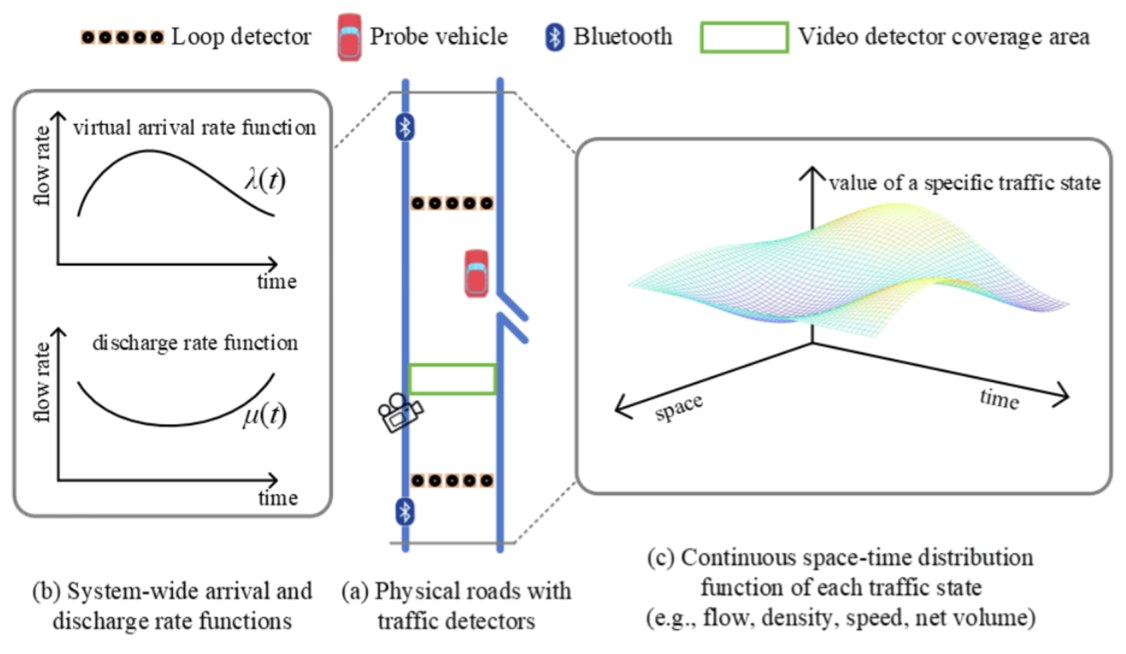
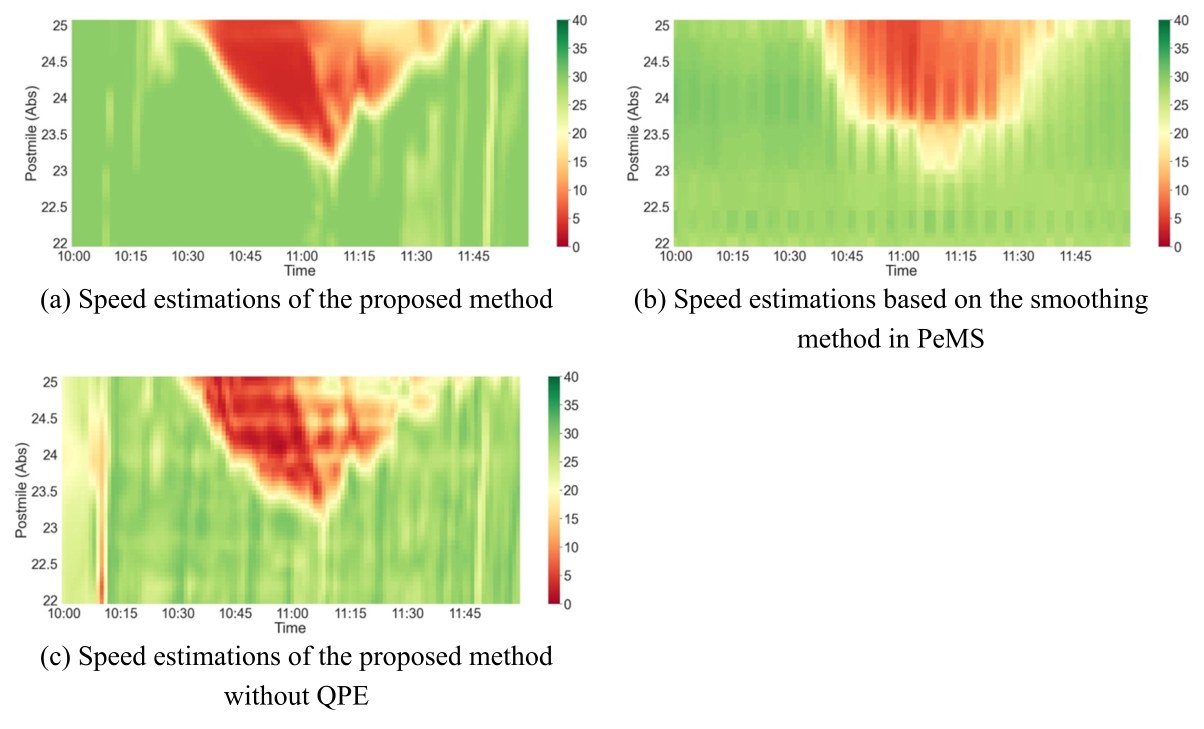
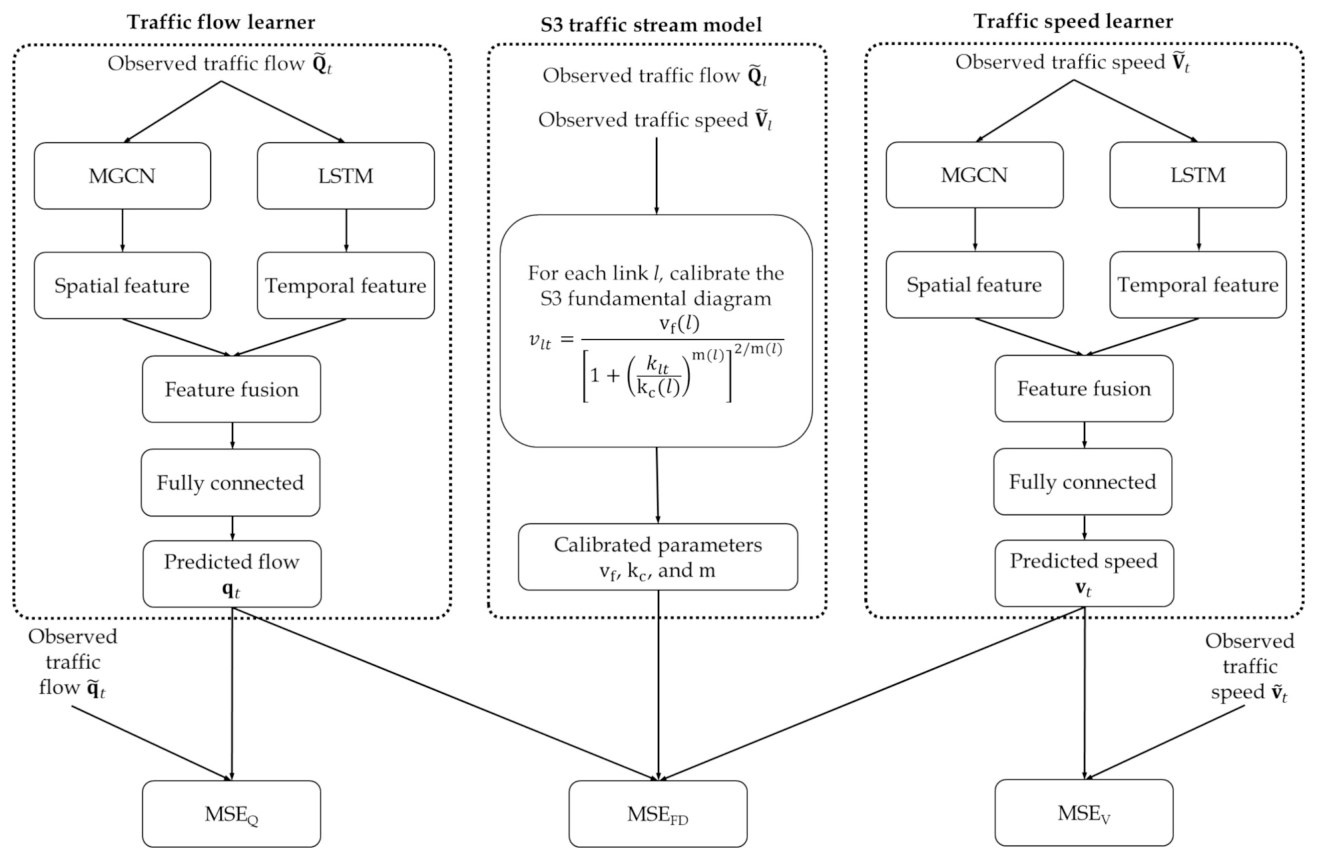
Lu, Li, Wu & Zhou (2023), TR-C; Shao, Shao, Wu, Cheng & Lam (2025), TR-C.
Insight: the physics layer recovers congestion shockwaves that pure data smoothing misses, and keeps predicted speed–flow pairs on a calibrated fundamental diagram.
- Shao, F., Shao, H., Wu, X. (corresponding), Cheng, Q., Lam, W.H.K. (2025). A physics-informed machine learning framework for speed-flow prediction: Integrating an S-shaped traffic stream model with deep learning models. Transportation Research Part C, 180, 105362. DOI
- Lu, J., Li, C., Wu, X., Zhou, X.S. (2023). Physics-informed neural networks for integrated traffic state and queue profile estimation: A differentiable programming approach on layered computational graphs. Transportation Research Part C, 153, 104224. DOI
2. Emerging Data: LBS, Climate & Health
With the Villanova team, I combine location-based service (LBS) data, climate and satellite data, and public-health data to measure how people move during disasters and epidemics, in the U.S. Gulf Coast, Lagos (Nigeria) and South Africa.
2.1 LBS data: human mobility during extreme events
Field case: U.S. Gulf Coast, Hurricane Laura (2020). Mobile-device location data for counties in Louisiana and Texas show how the hurricane and evacuation orders changed trips, and how those trips shaped COVID-19 spread.
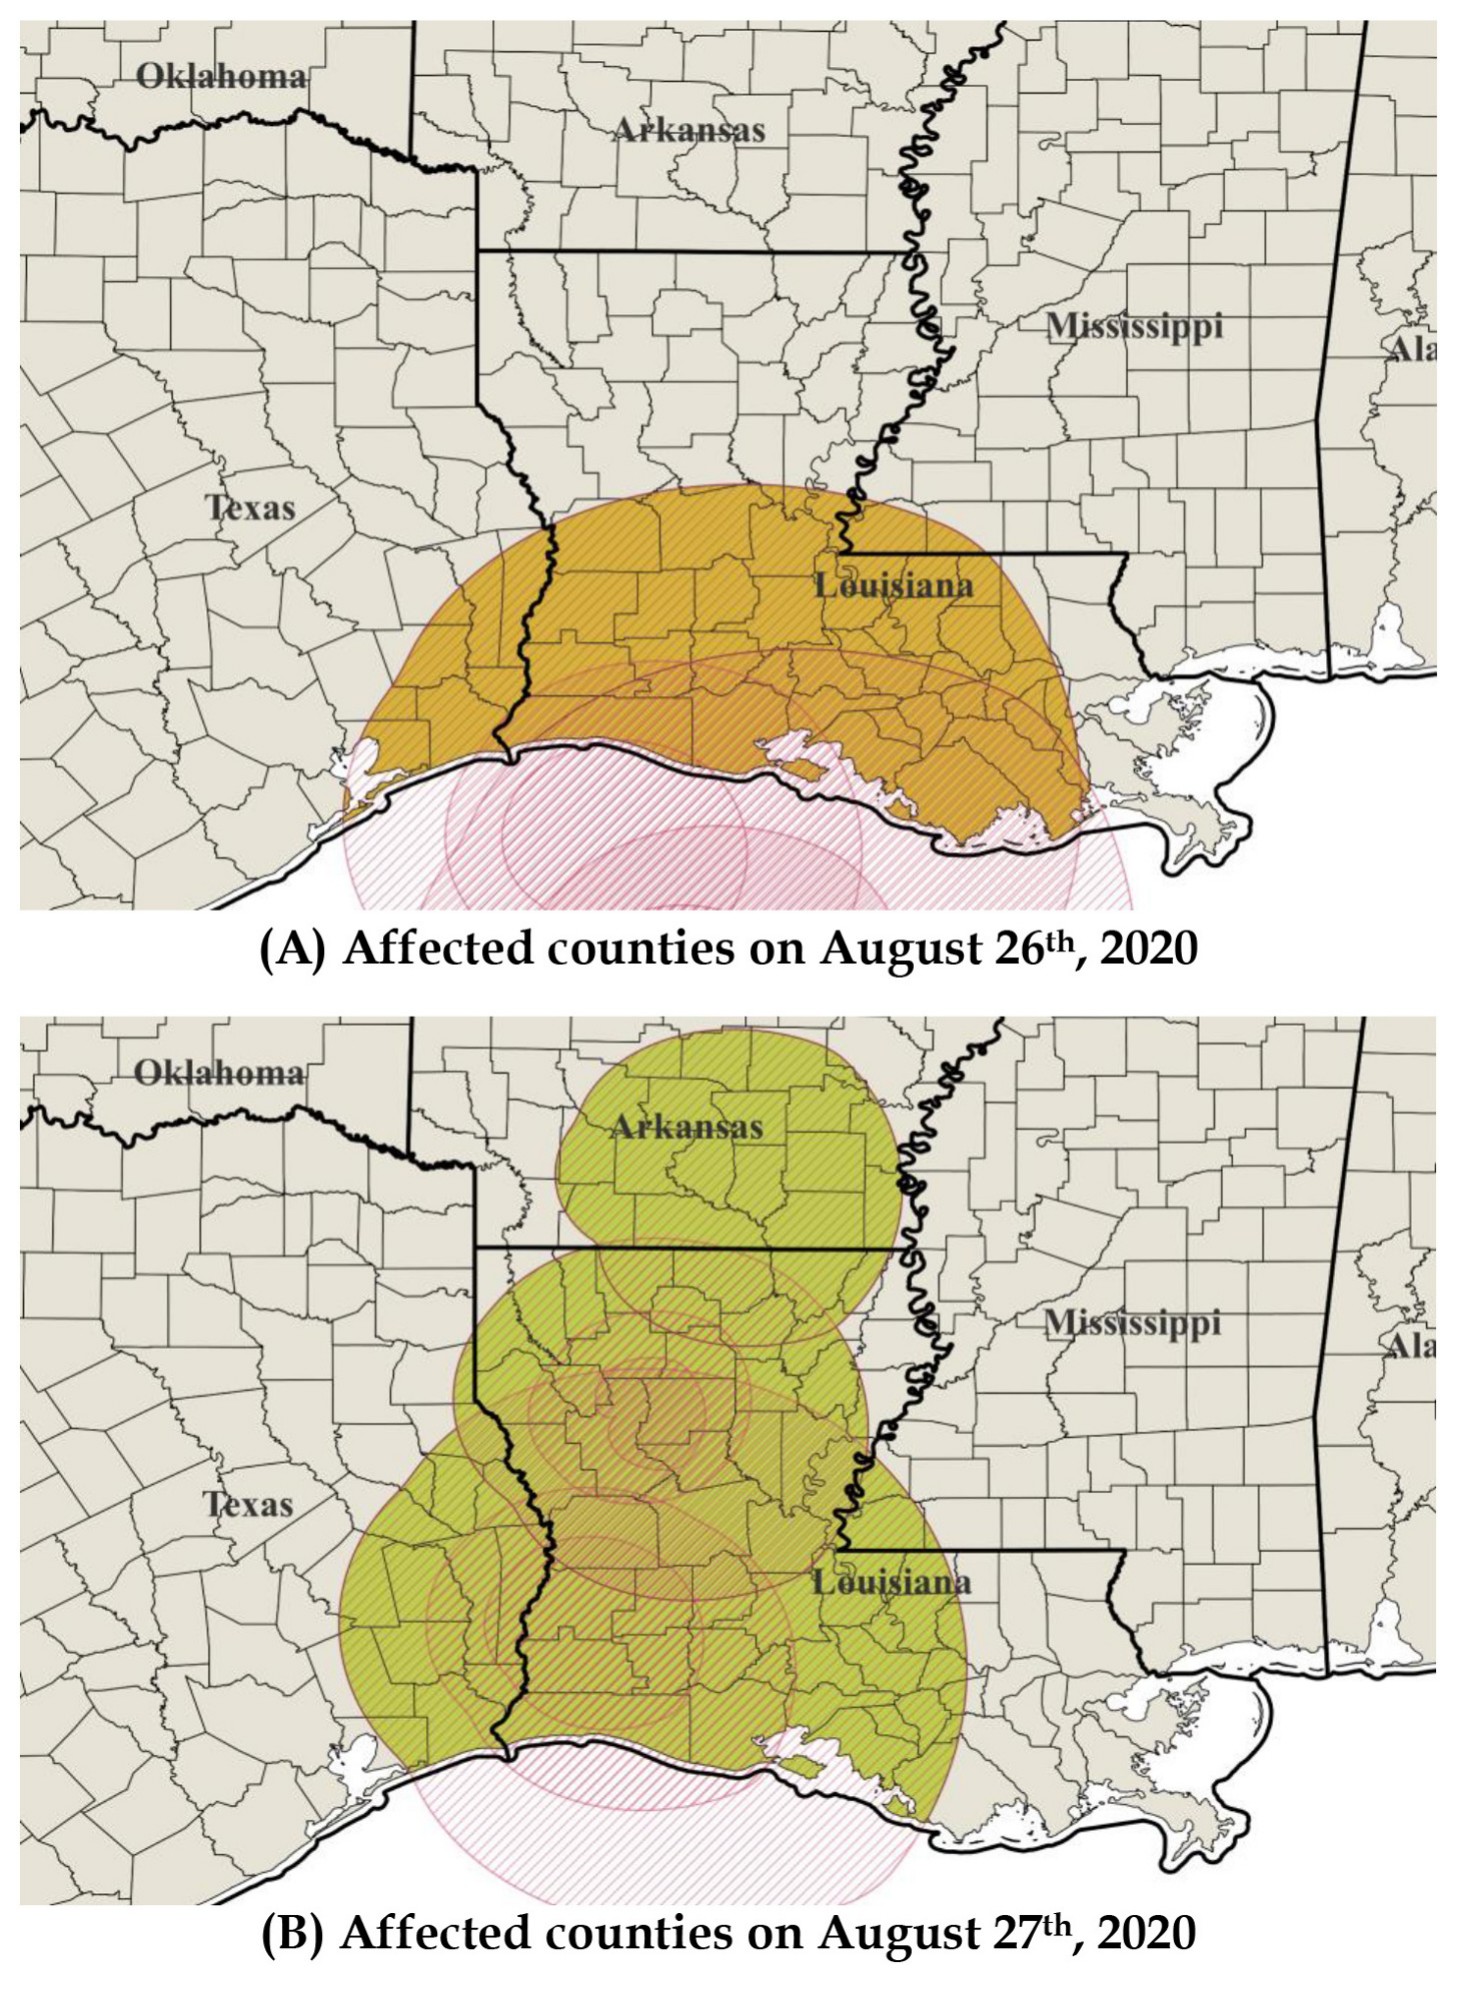
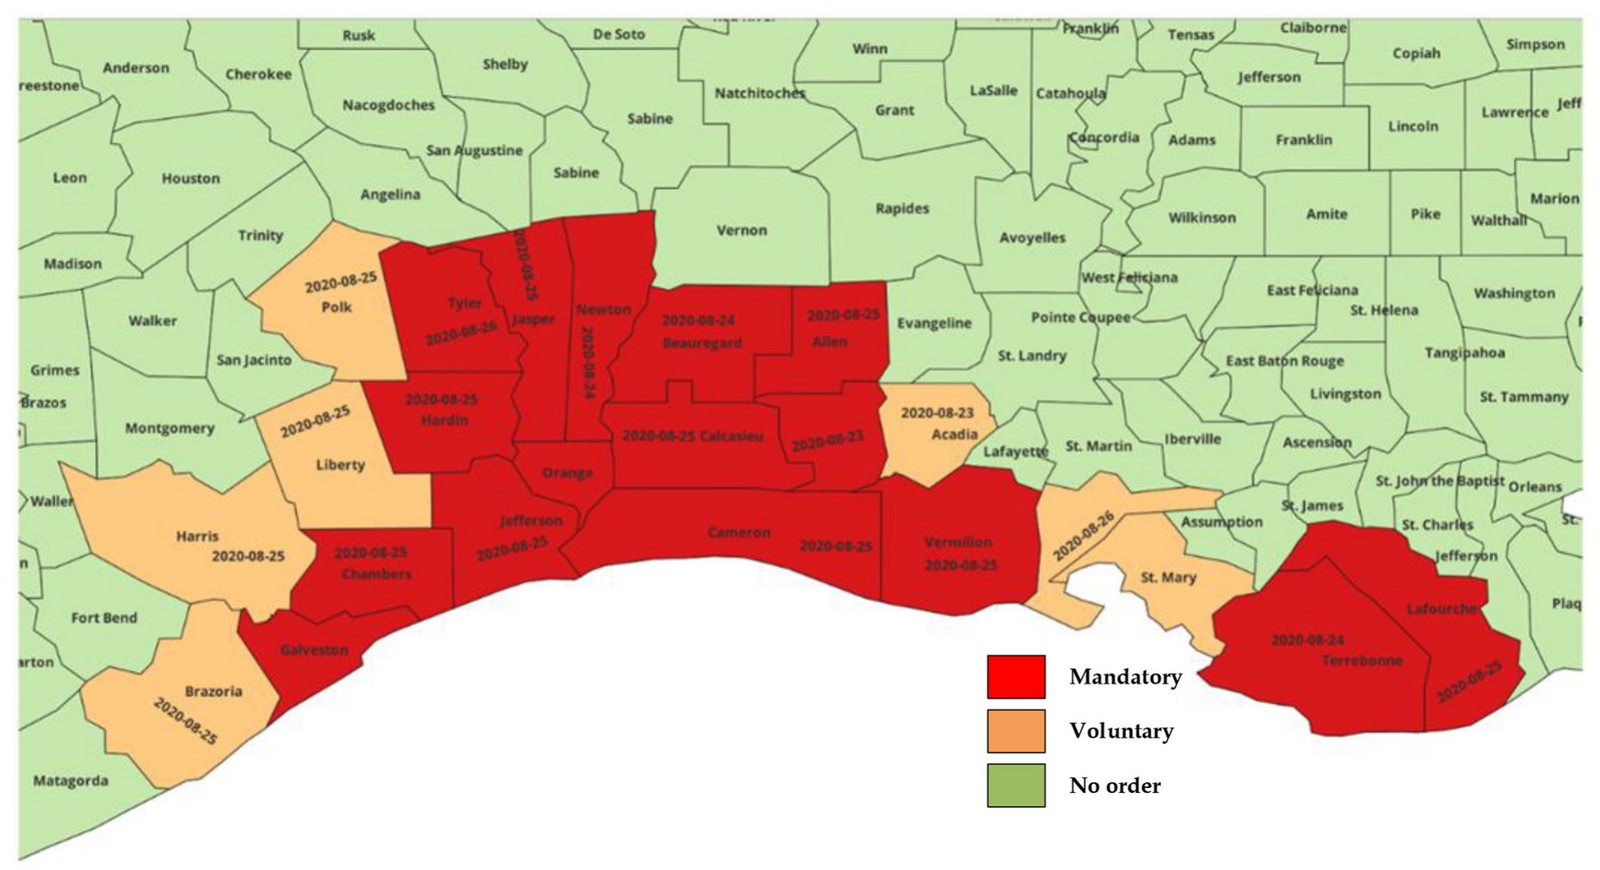
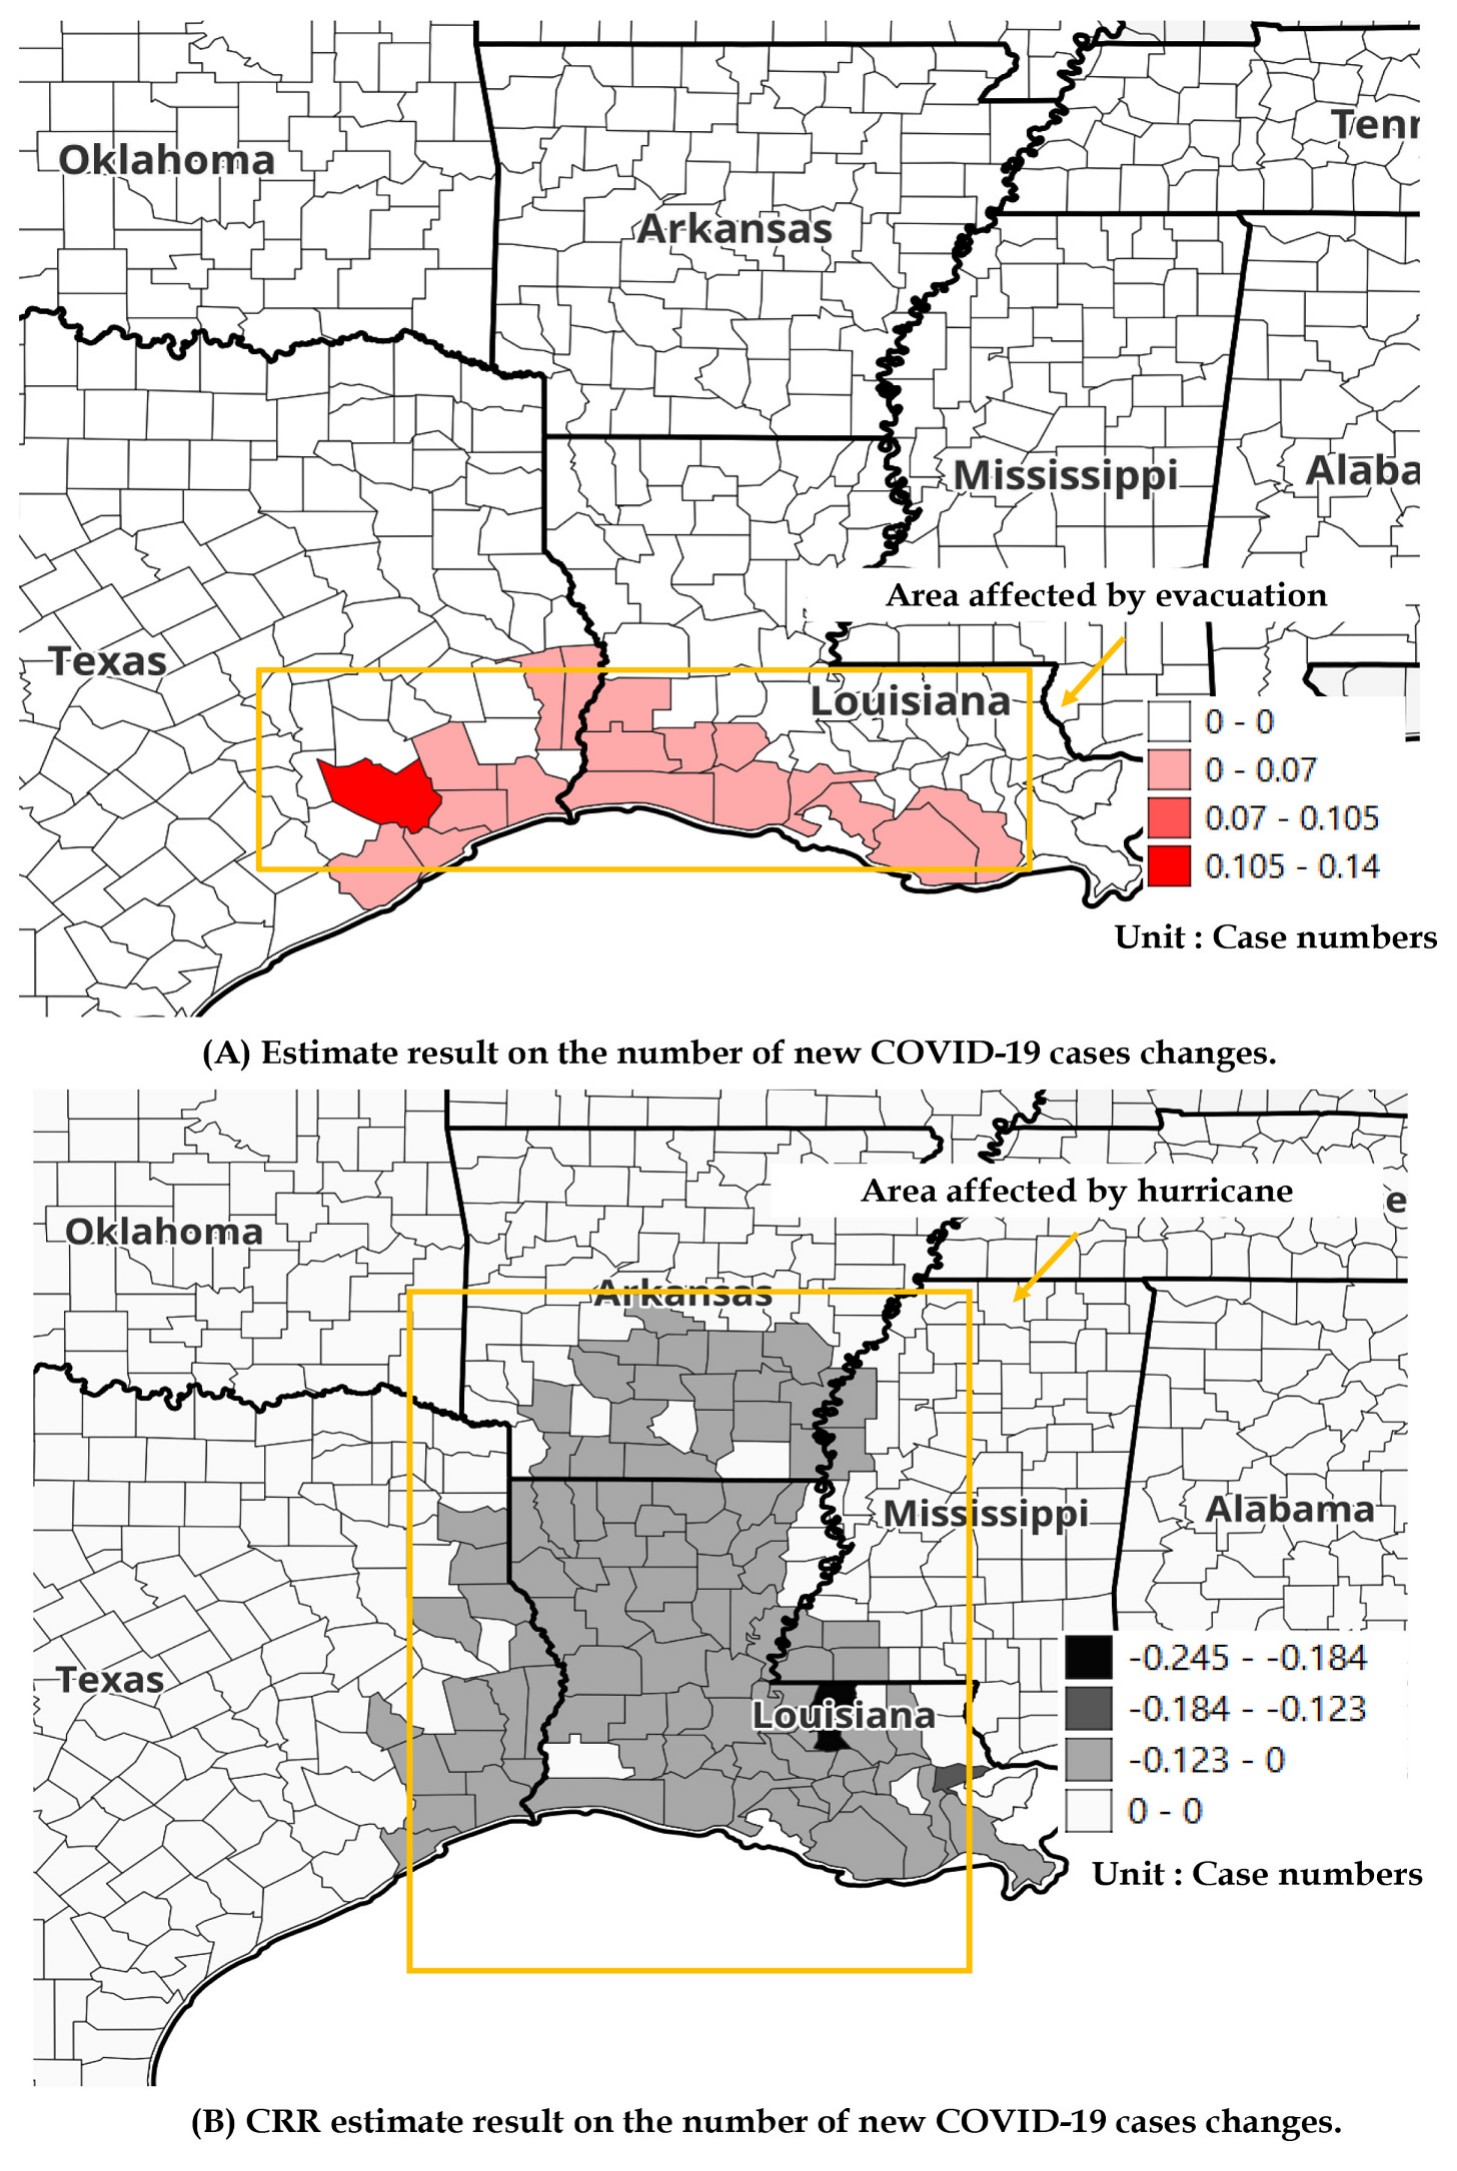
Liu, Wu, Molnar, Hu, Zhang & Xiong (2025), Journal of Transport Geography.
Map-matching volatile LBS trajectories. Raw LBS points are sparse and noisy, so they must be snapped to the road network before trips can be measured. Sup-HMM, a Bayesian-optimized hidden Markov model, keeps map-matching accurate on volatile trajectories (Li, Wu et al. 2026, IEEE Transactions on Intelligent Transportation Systems, co-first author; DOI).
2.2 Climate data: satellite flood mapping and precipitation
Field cases: Lagos State and Nigeria (2020 rainy season). Sentinel-1 satellite imagery and ERA5 precipitation locate floods; LBS data on visits to points of interest measure how people responded, from Lagos neighborhoods to all of Nigeria.
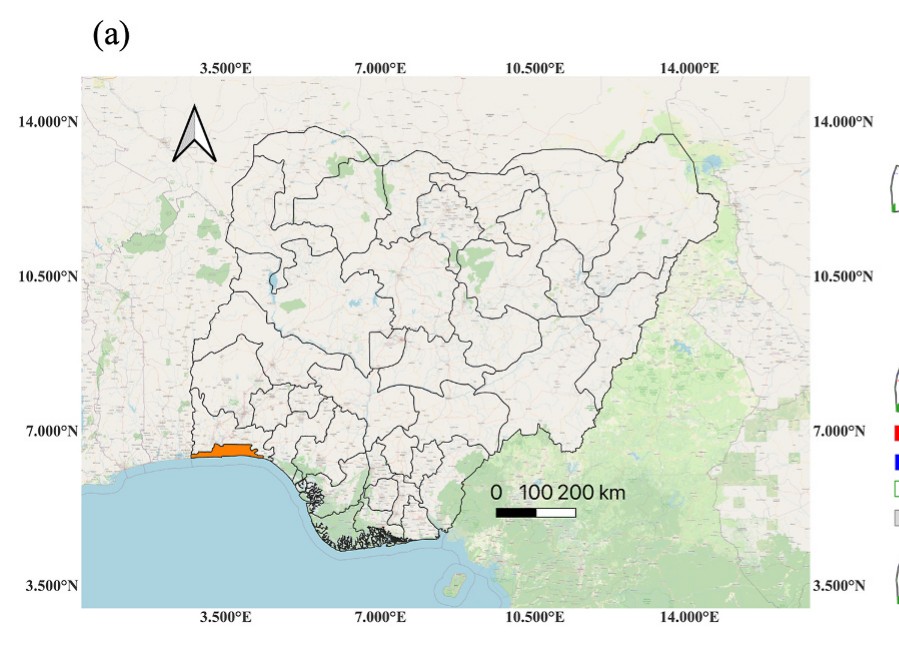
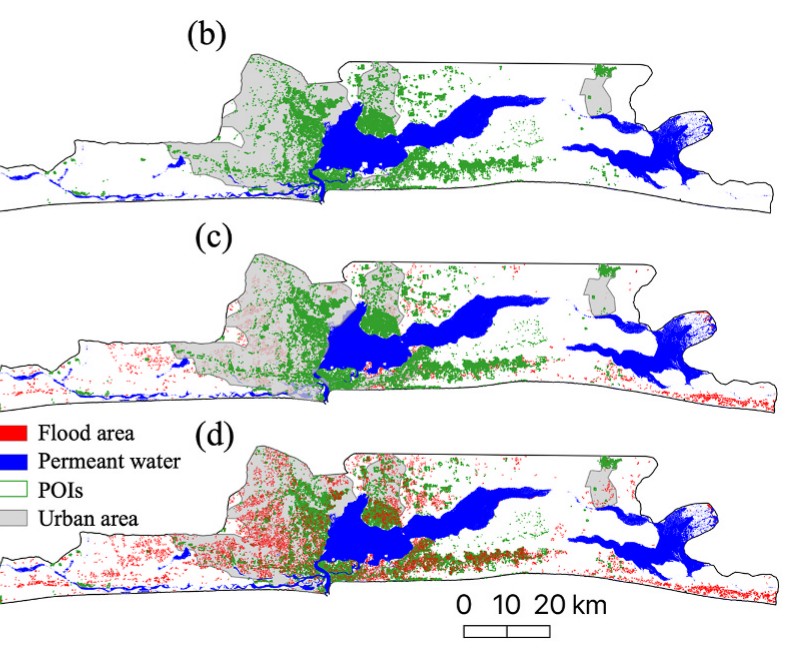
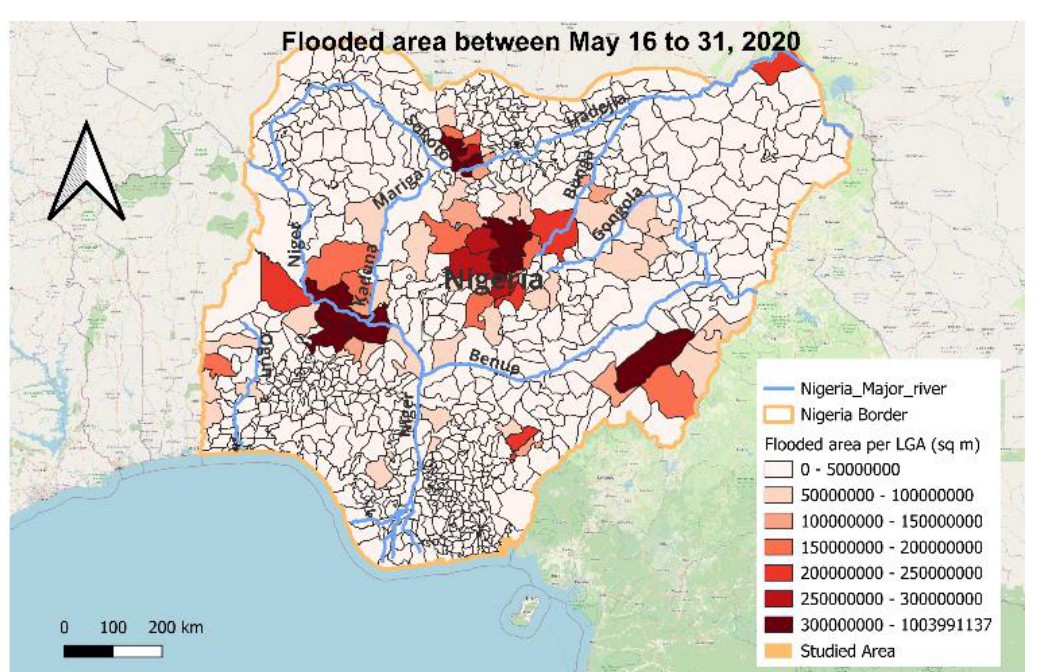
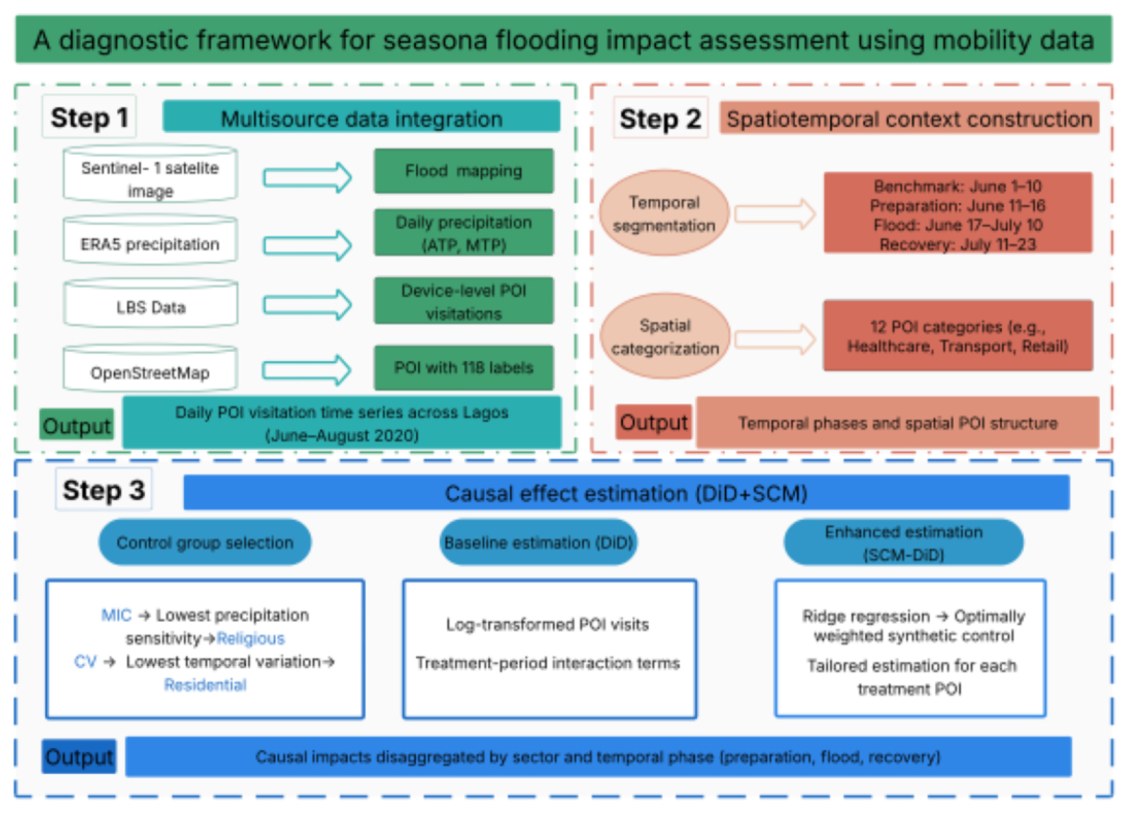
Zhang, Wu et al. (2026), International Journal of Disaster Risk Reduction; Liu, Wu et al. (2024), IEEE GHTC.
2.3 Health data: mobility and SARS-CoV-2 transmission (South Africa and Lagos)
Field case: South Africa (all 9 provinces). Panel mobile-phone sighting data reveal how inter-regional travel shaped the spread of SARS-CoV-2 variants.
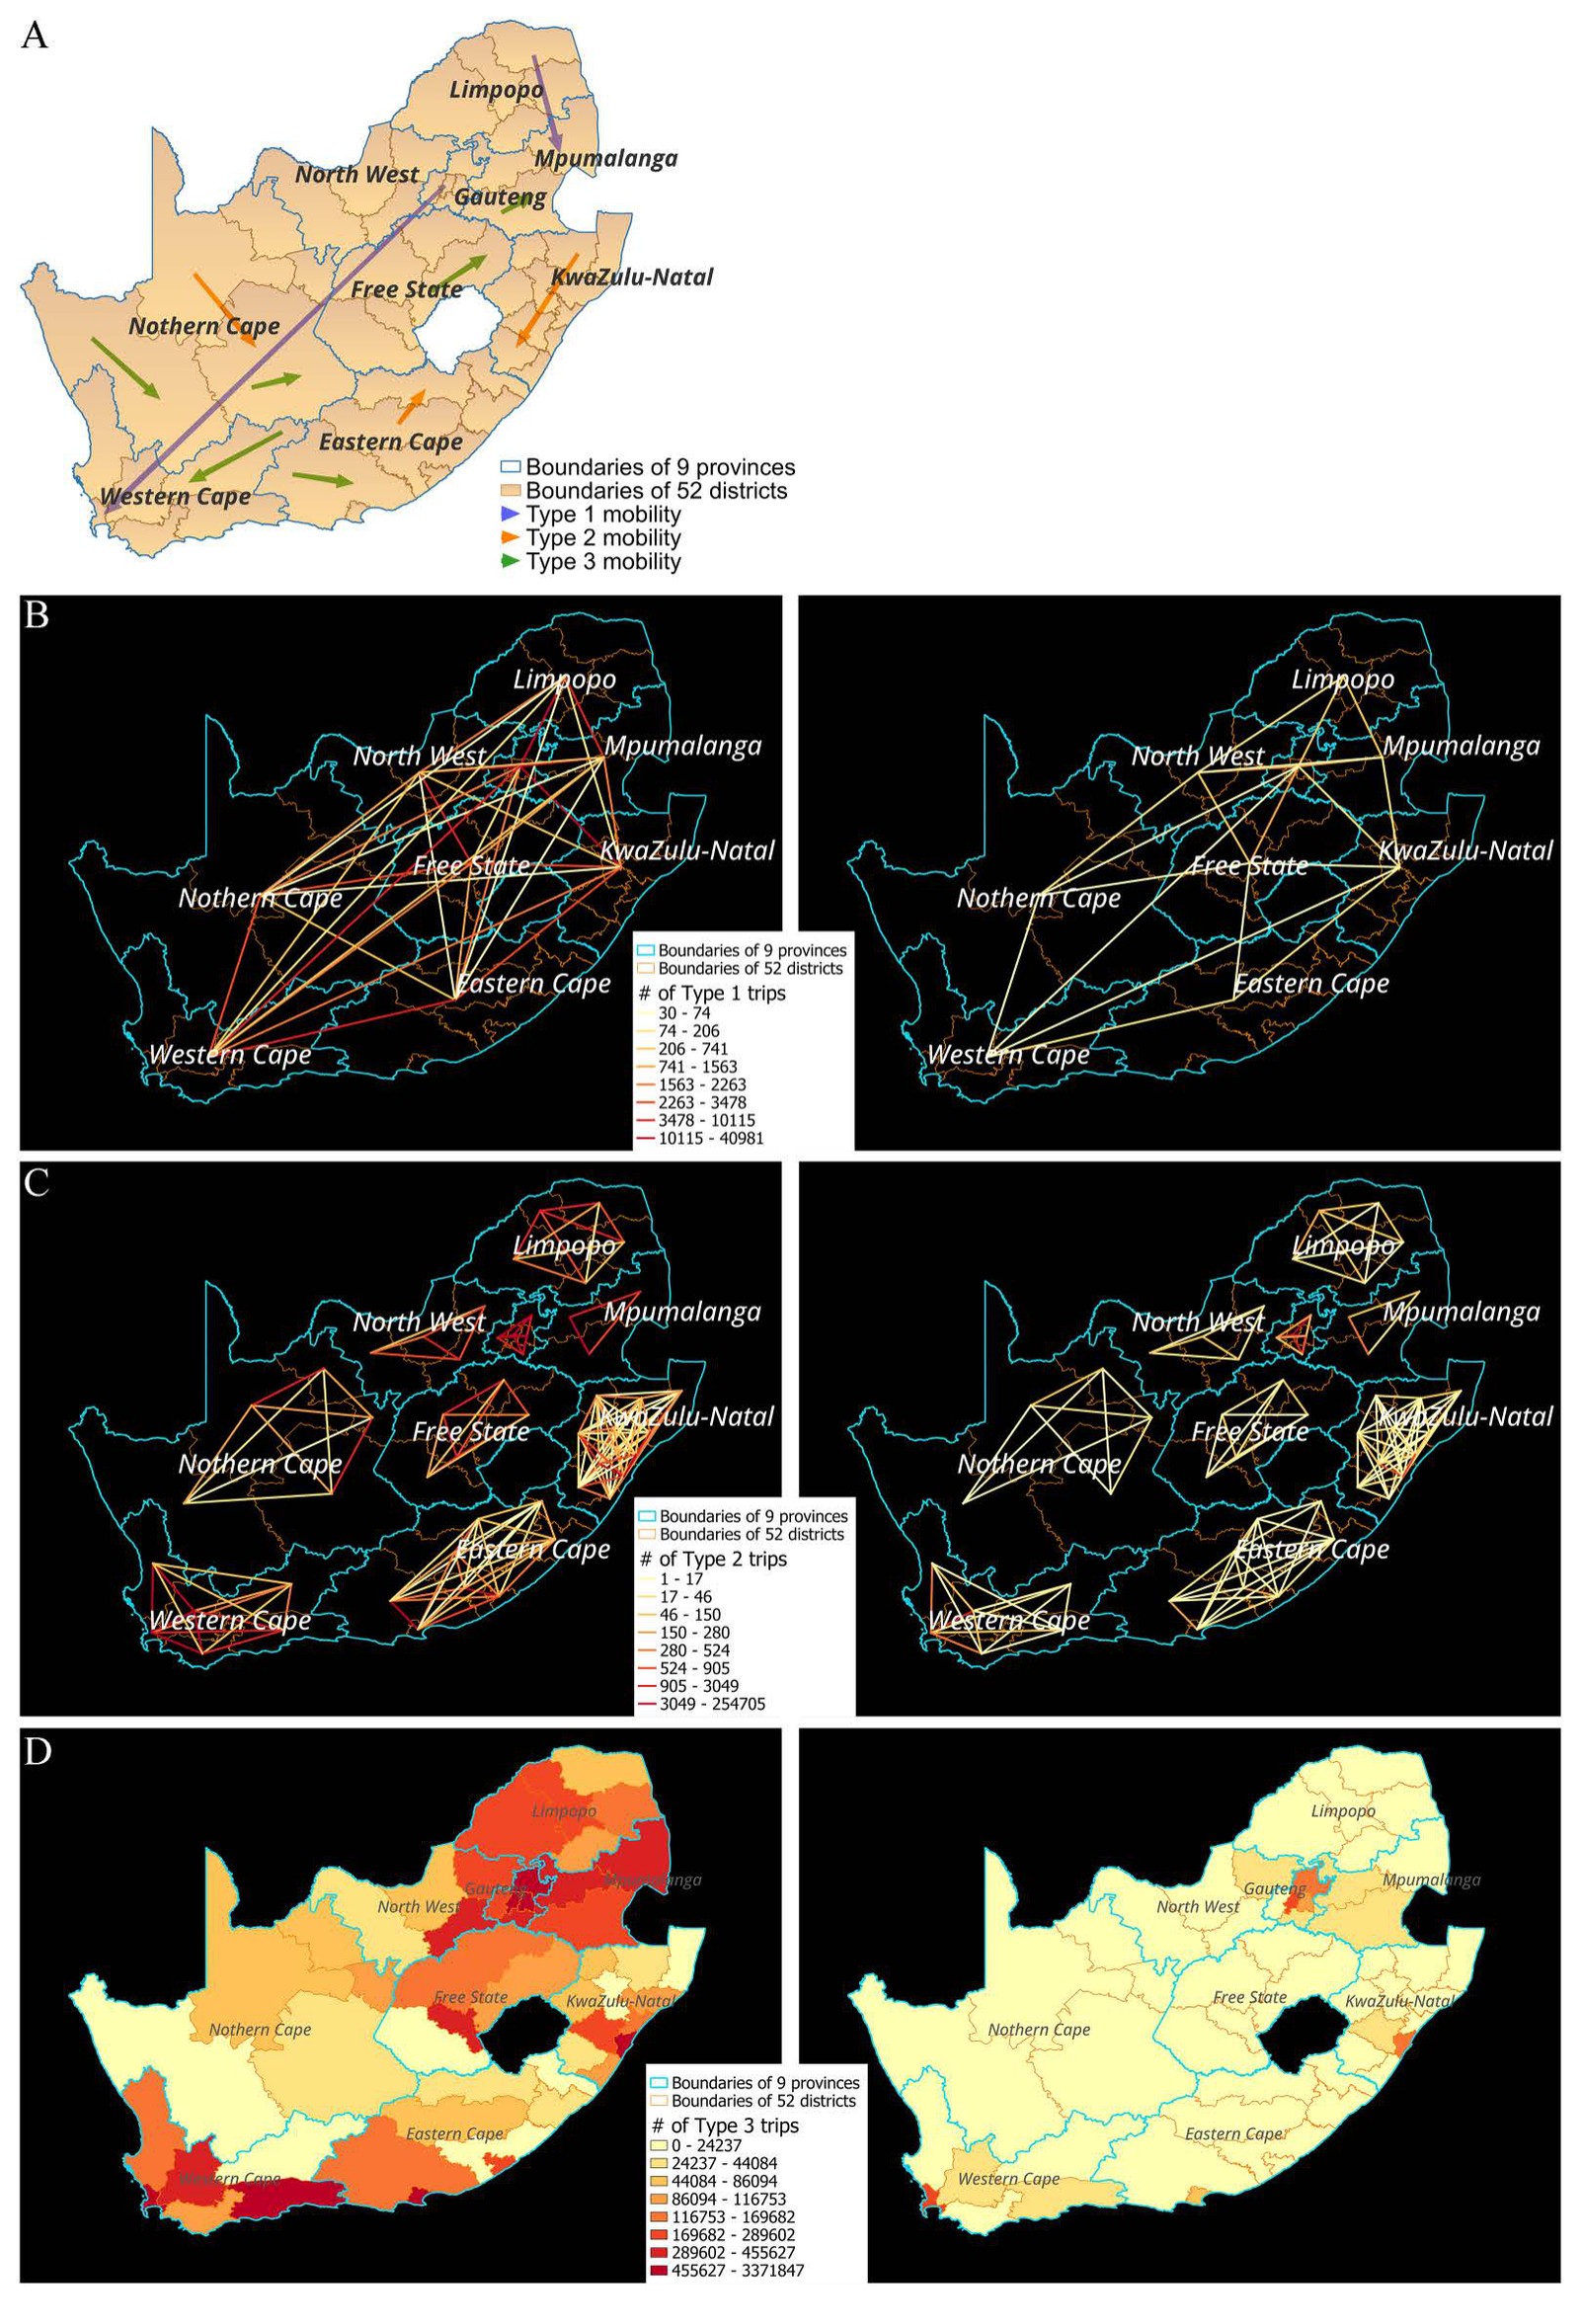
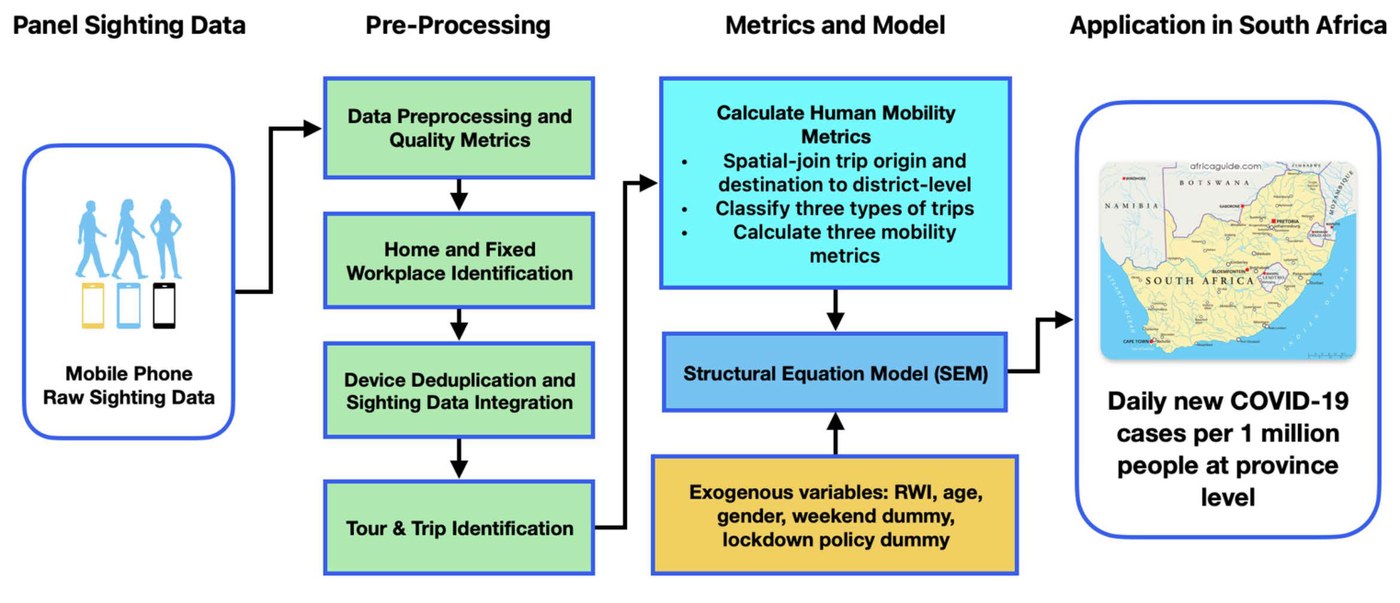
Luo, Wu et al. (2025), PLOS ONE, INFORM Africa research hub.
Field case: Lagos State, Nigeria (2020, under review). Billions of mobile-device sightings are turned into city-wide daily mobility for the population of Lagos State and linked with serology data to estimate how mobility restrictions changed COVID-19 spread.
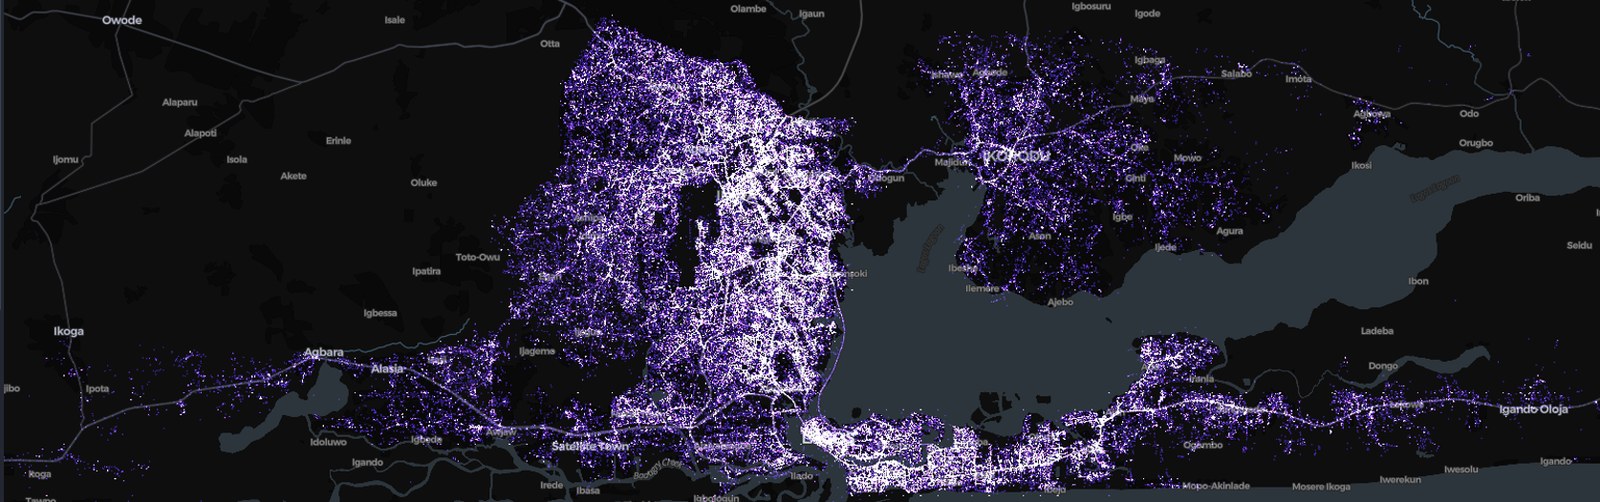
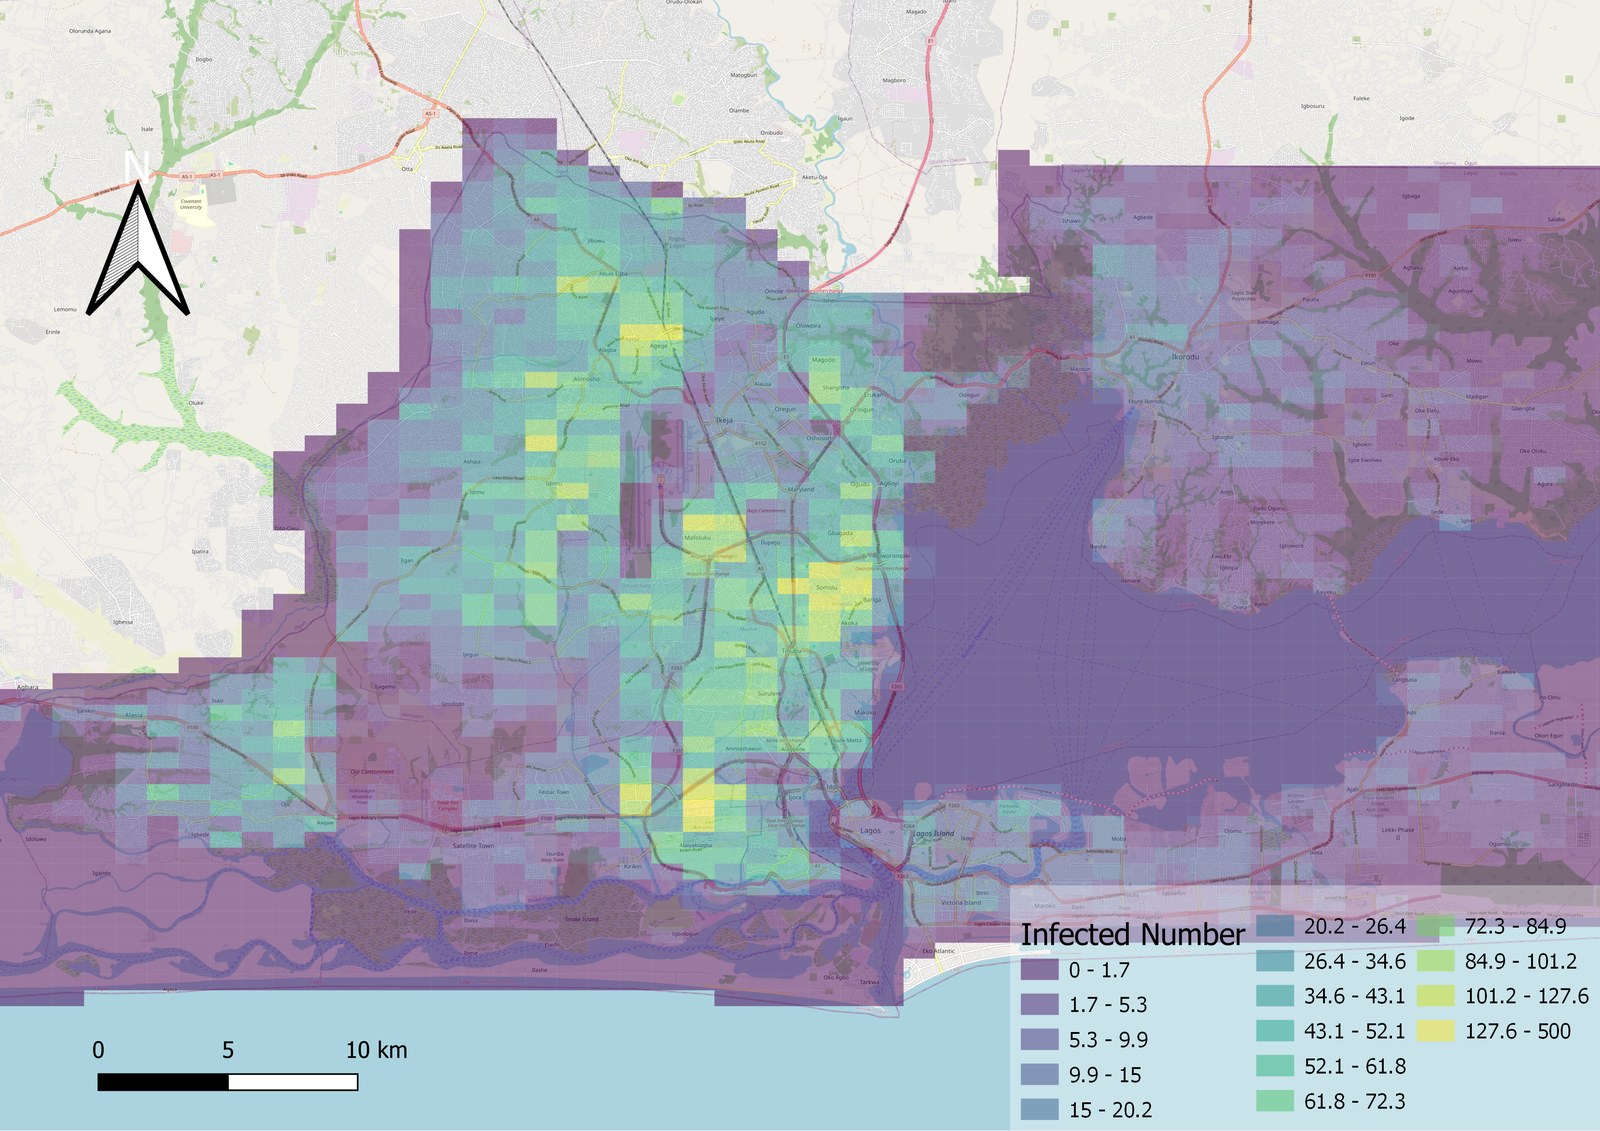
Liu, Wu (co-first author), Xiong et al., manuscript under review (2026), INFORM Africa research hub.
Ongoing pilot: mobility and non-communicable diseases across 7 African countries. Can mobile-phone mobility tell us about chronic disease risk? Mobility metrics (walking share, driving share, trips per day, distance from home, night trips) are compared with 2019 incidence of diabetes, cardiovascular disease, stroke and chronic respiratory disease in Nigeria, South Africa, Ghana, Botswana, Gabon, Congo and Ethiopia.
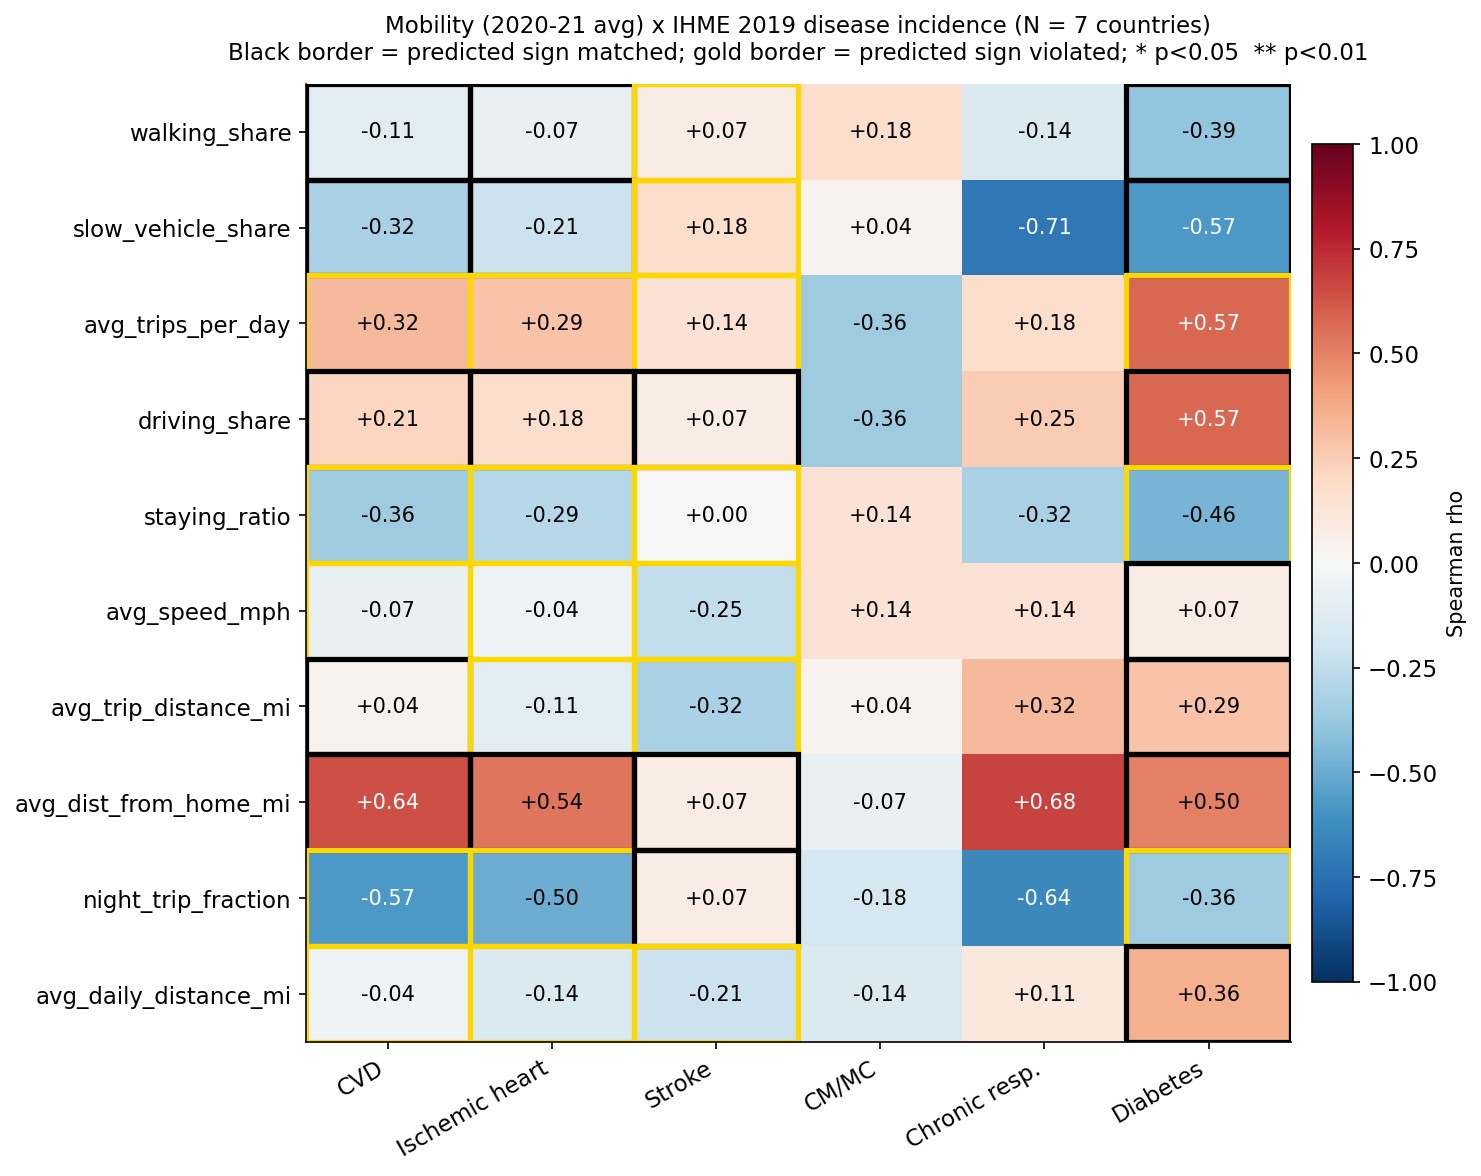
Insight: mobility is the missing link between hazards and health outcomes. Shifting the unit of analysis (e.g., from places to facility types) makes causal inference possible even when no unaffected control region exists.
- Liu, K., Wu, X., Molnar, L., Hu, S., Zhang, L., Xiong, C. (2025). Characterizing human mobility and its impact on the spread of COVID-19 during extreme weather events: A case study of hurricane Laura. Journal of Transport Geography, 129, 104423. DOI
- Liu, K., Wu, X., Zhang, L., Xiong, C. (2024). Characterize human mobility in Nigeria during flooding season and its impact in shaping the spread of COVID-19. IEEE GHTC 2024, 56–63. DOI
- Zhang, L., Wu, X., Liu, K., Al Mehedi, M.A., Zhou, J., Smith, V., Xiong, C. (2026). Diagnostic framework for causal inference in seasonal urban flooding: Precipitation-based control selection and synthetic difference-in-differences in Lagos, Nigeria. International Journal of Disaster Risk Reduction, 105993. DOI
- Zhang, L., Wu, X., Liu, K., Xiong, C. (2024). Evaluating the spatial-temporal impact of urban flooding on mobility patterns and point of interest. IEEE GHTC 2024, 424–430. DOI
- Luo, W., Wu, X., Li, R., Fitzpatrick, M., Charurat, M., Blanco, N., et al., Xiong, C. (2025). Variant patterns and influence of inter-regional travel during the SARS-CoV-2 expansion in South Africa. PLOS ONE, 20(11), e0329621. DOI
INFORM Africa (NIH): this work is part of the NIH-funded INFORM Africa research hub (Project 2: human mobility and infectious disease dynamics), where I serve as project manager and co-developed an open training package for African researchers. See Teaching & Training.
3. Transportation Multi-Resolution Modeling (MRM) & World Models
Planning models (macro), dynamic traffic assignment (meso) and queue dynamics (micro) are connected through queue-based performance functions. The inflow demand-to-capacity ratio drives congestion duration, speed drop and delay, bridging the polynomial arrival queue model and volume-delay functions. This line also covers my work on traffic assignment and dynamic traffic assignment for FHWA, ADOT, MAG and NVTA.
Phoenix case: regional network and freeway corridor. For the Maricopa Association of Governments (MAG), I calibrated queue-based V/C ratios across the full regional network, and on the ADOT I-10 corridor, cumulative arrival and discharge curves turn detector counts into queue length, delay and congestion duration.
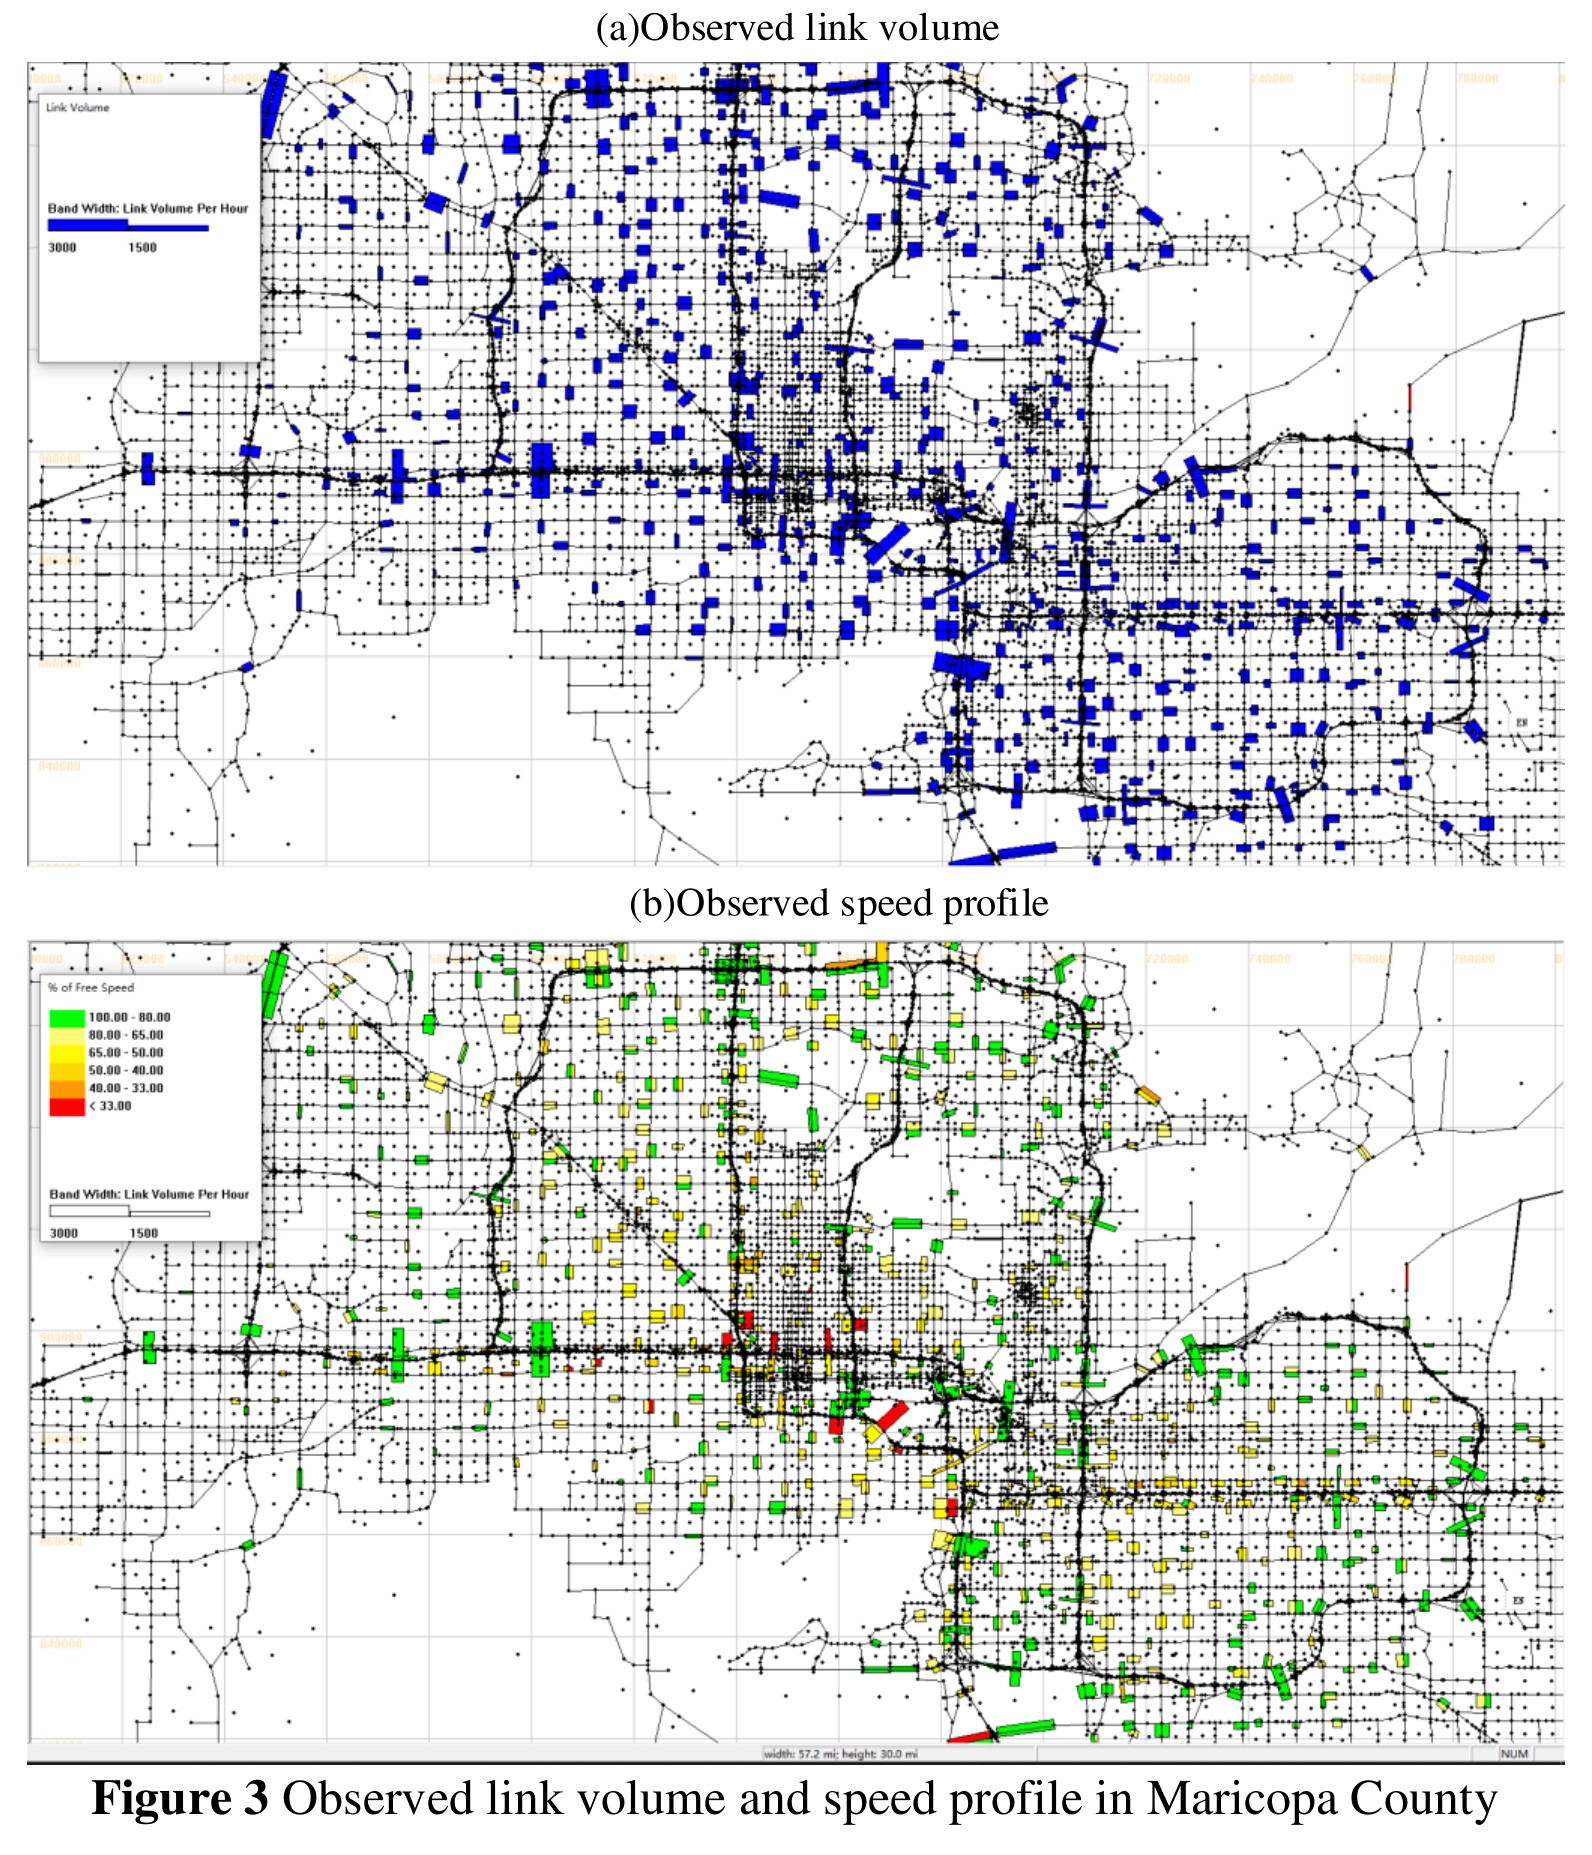
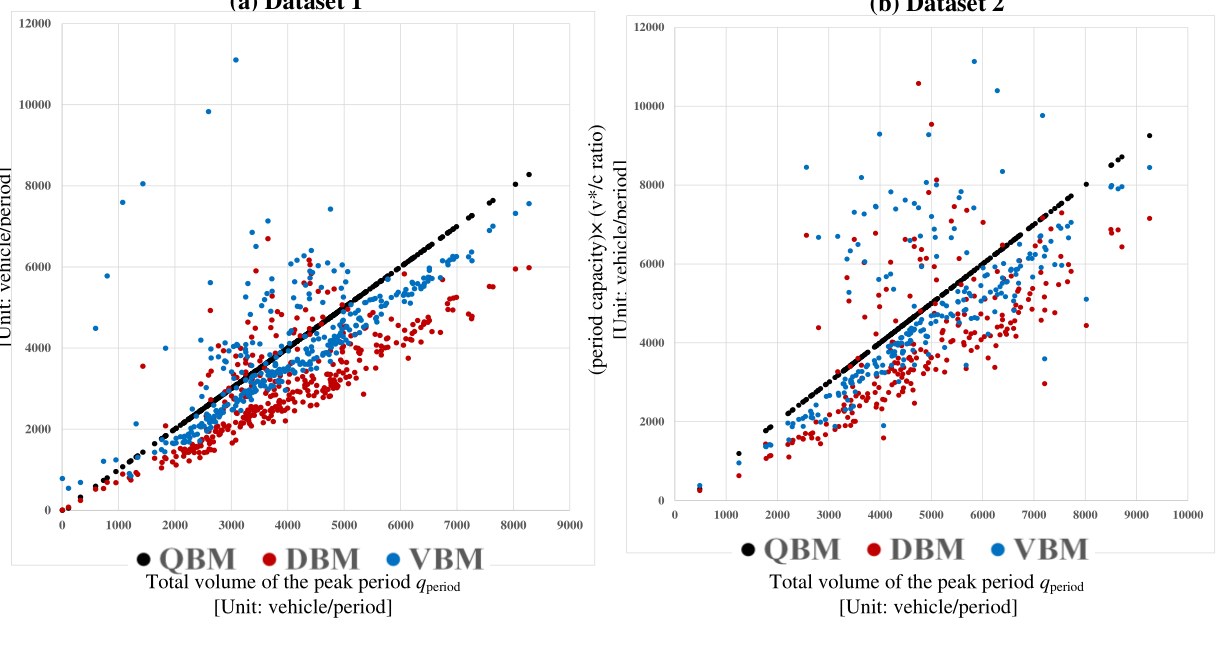
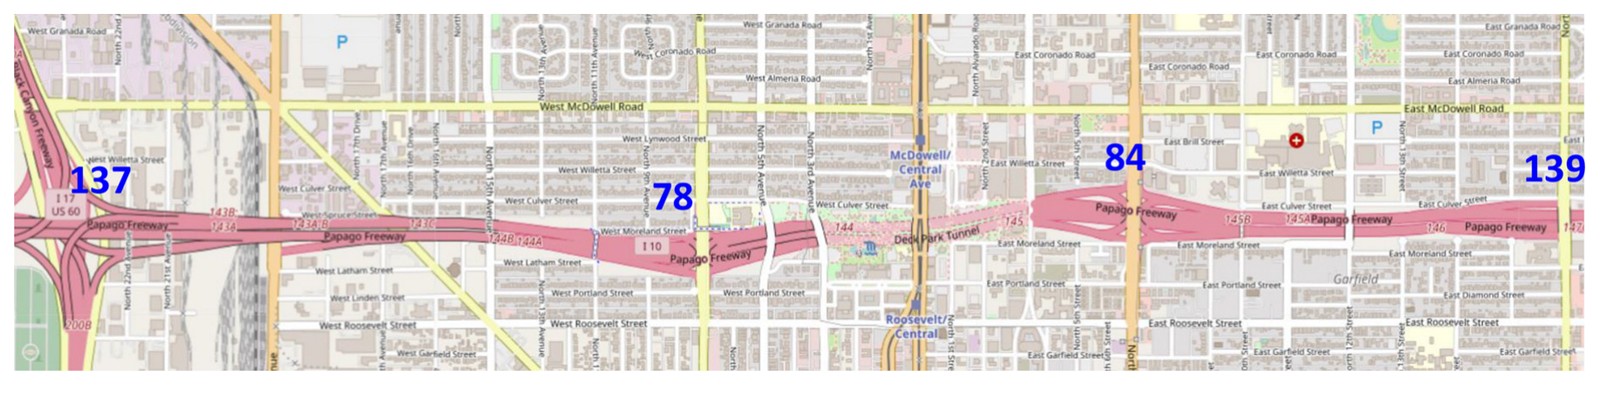
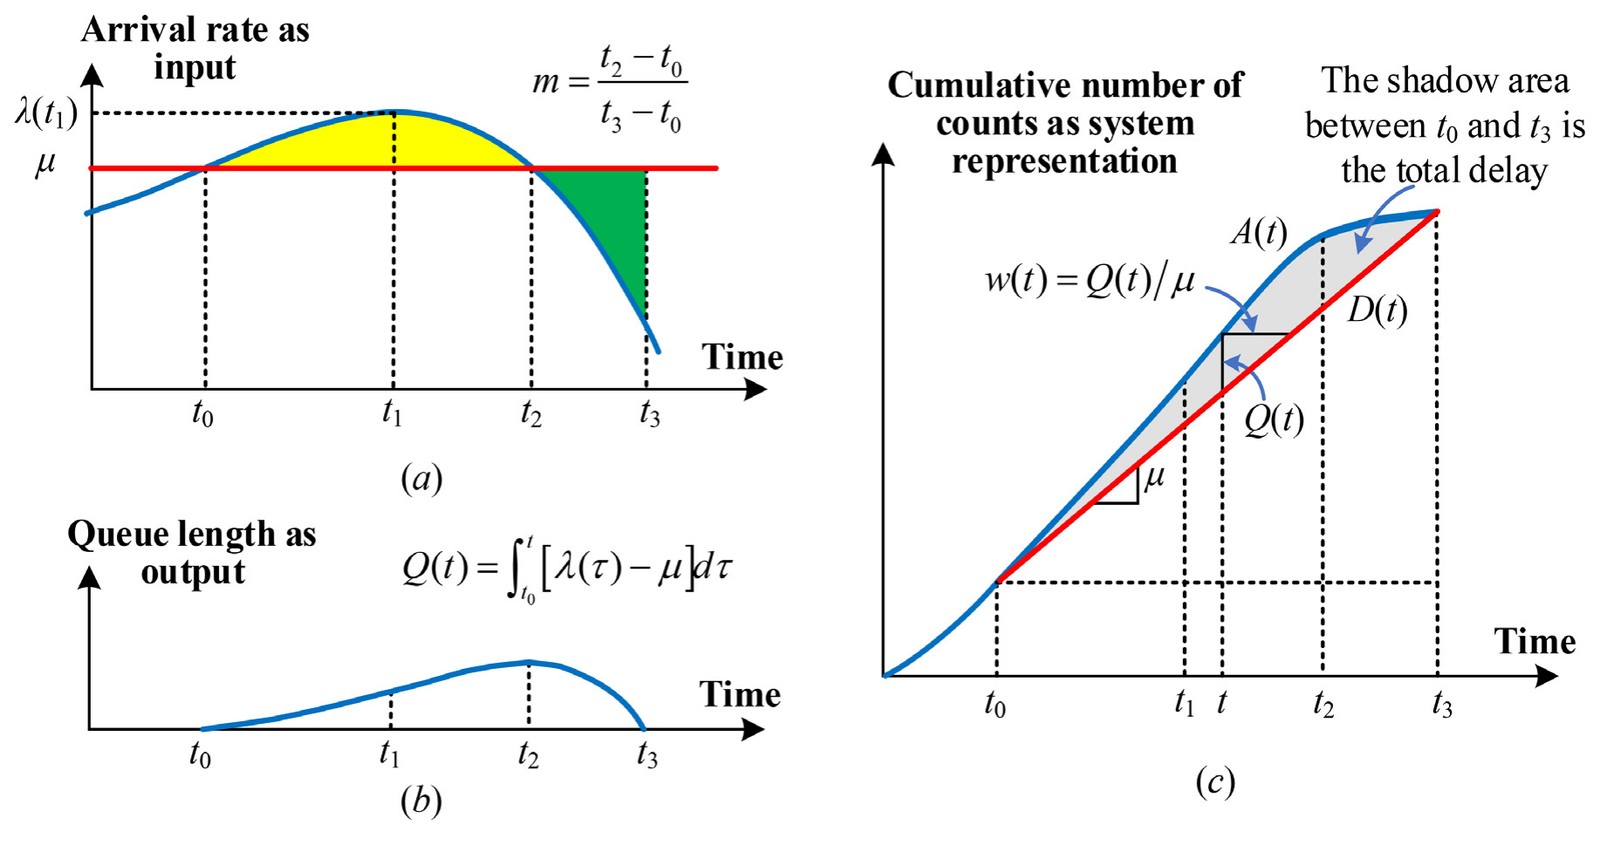
Regional network and V/C calibration: Wu, Dutta, Zhang, Zhu, Livshits & Zhou (2021), TRB Annual Meeting. I-10 corridor and cumulative-curve queue model: Zhou, Cheng, Wu (corresponding) et al. (2022), Multimodal Transportation.
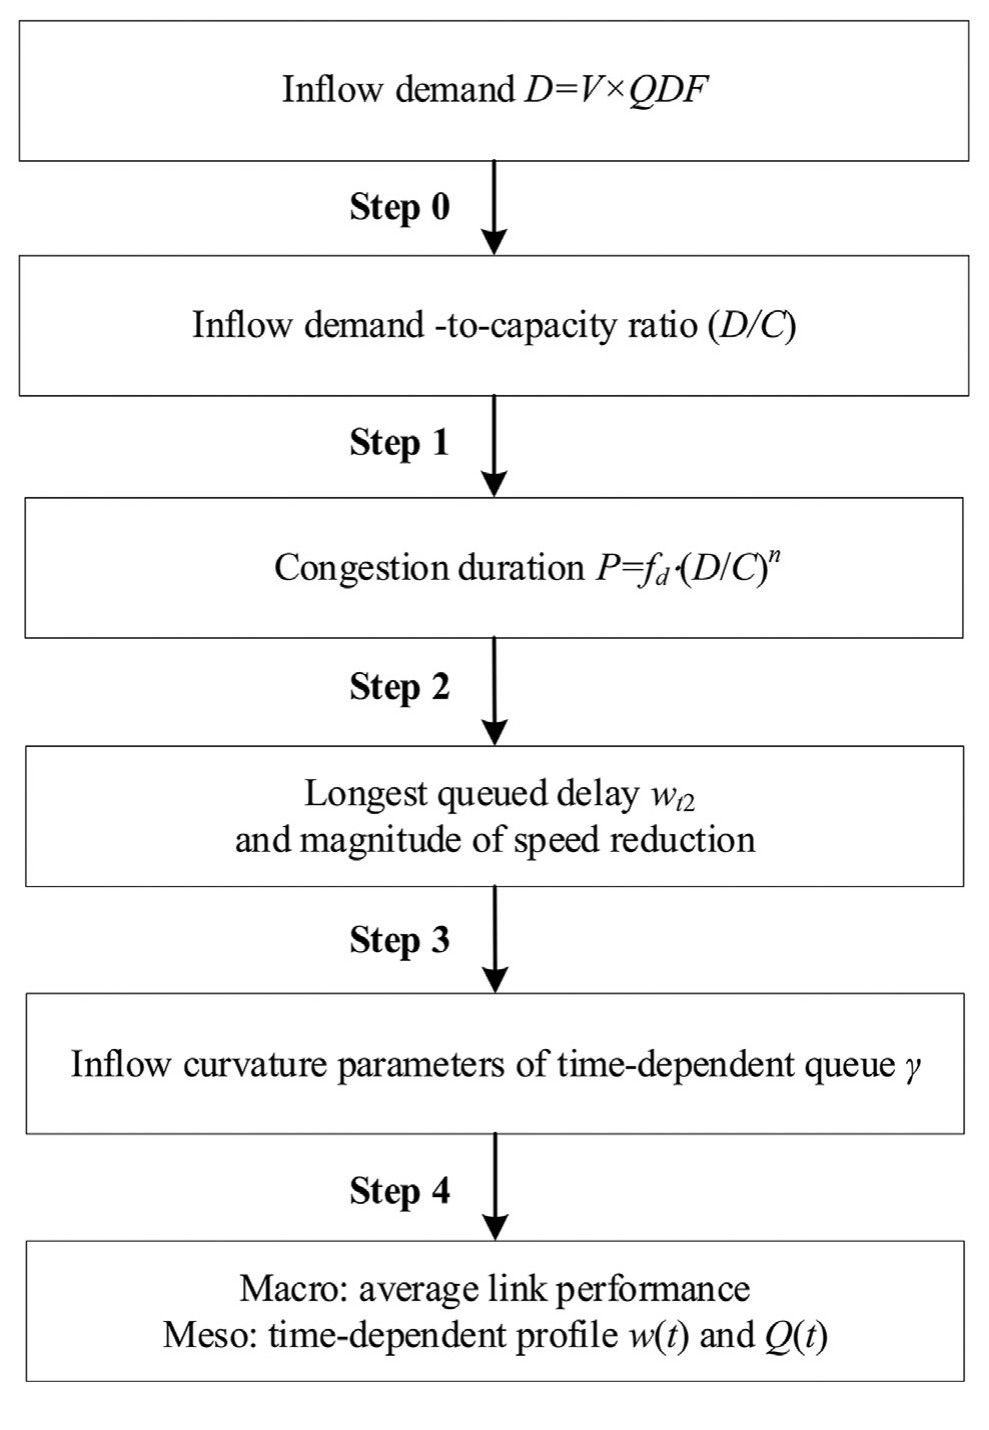
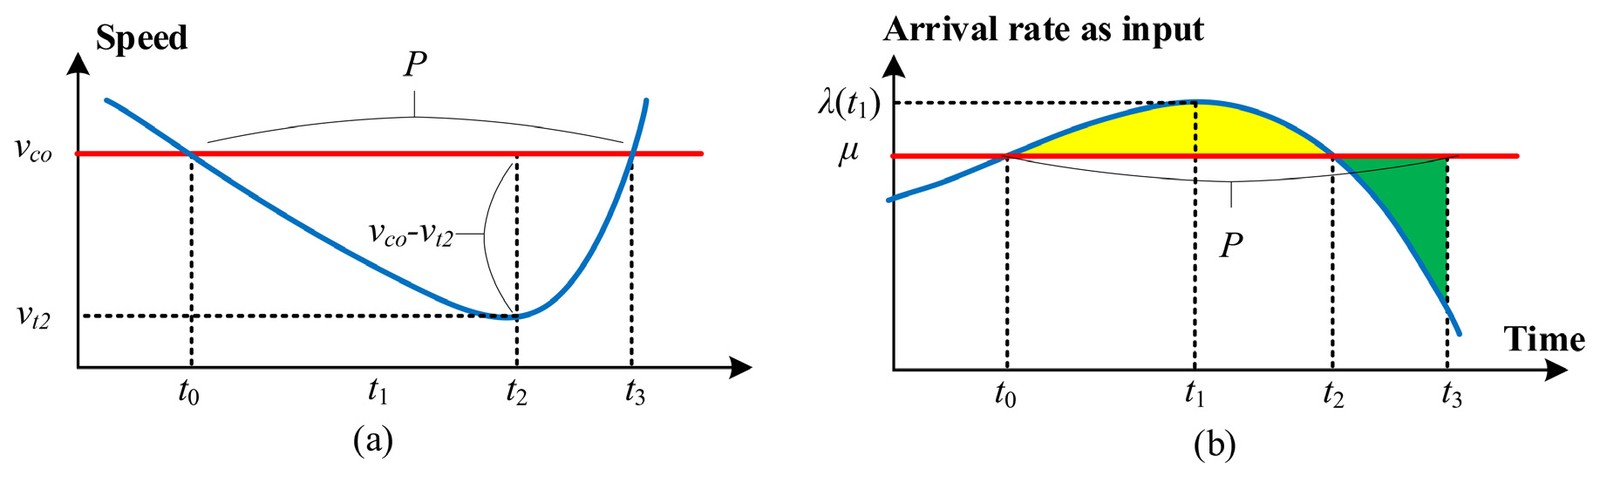
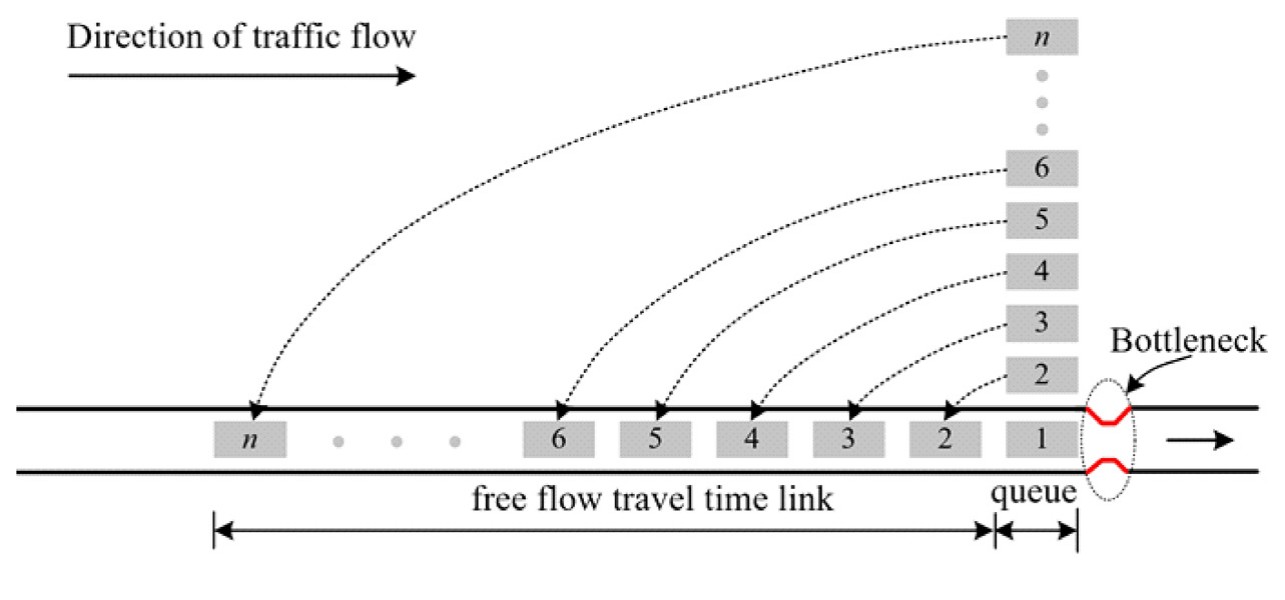
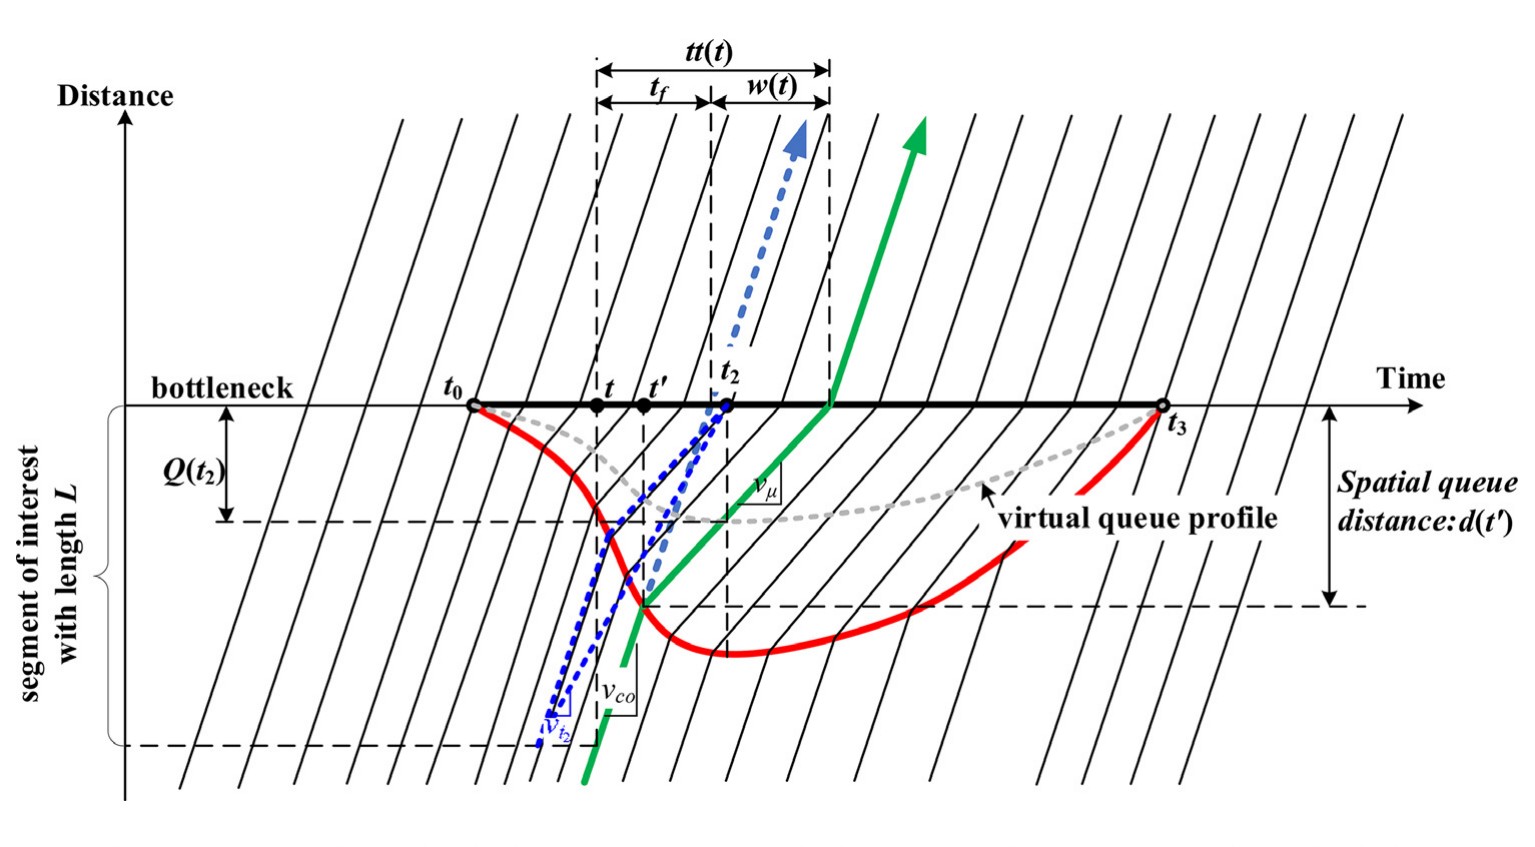
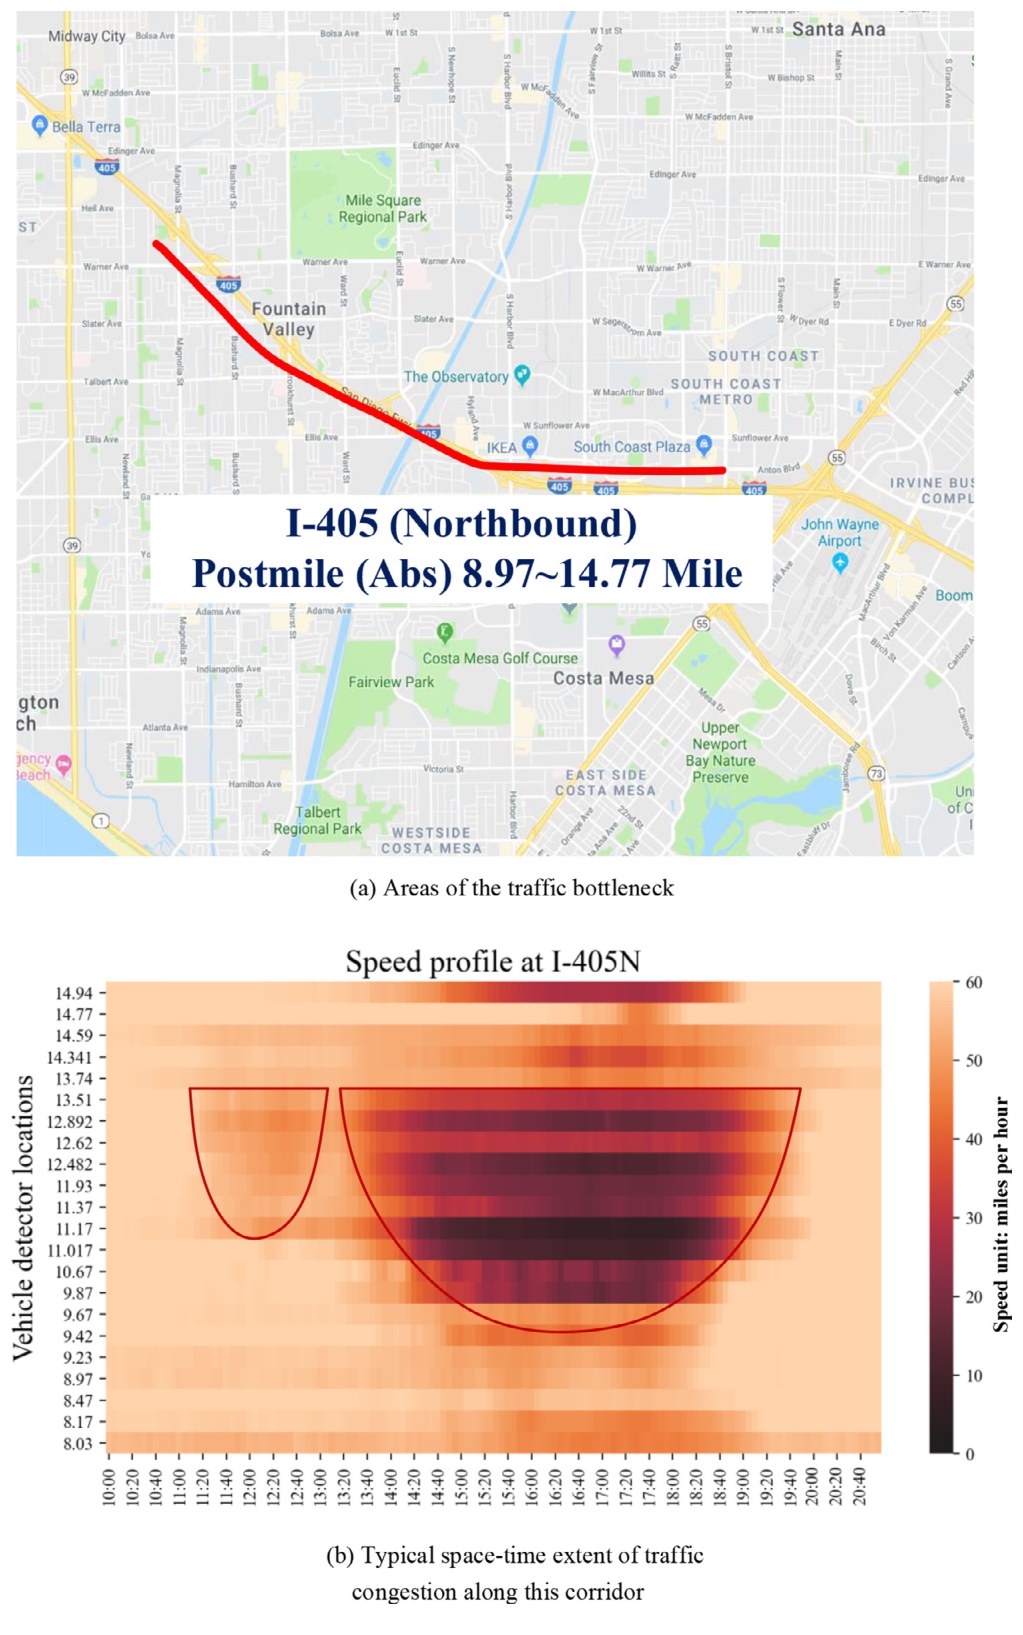
Meso-to-macro cross-resolution approach (Zhou, Cheng, Wu et al., 2022, Multimodal Transportation, 2022 Best Article Award) and queue-based V/C calibration (Wu et al., TRB 2021, cited by an FHWA handbook).
Insight: a queue-based V/C ratio gives capacity estimates that stay consistent across resolutions, so one calibrated network can serve regional planning models (FHWA, ADOT, MAG) as well as dynamic traffic assignment.
- Zhou, X.S., Cheng, Q., Wu, X. (corresponding), Li, P., Belezamo, B., Lu, J., Abbasi, M. (2022). A meso-to-macro cross-resolution performance approach for connecting polynomial arrival queue model to volume-delay function with inflow demand-to-capacity ratio. Multimodal Transportation, 1(2), 100017. DOI
- Wu, X., Dutta, A., Zhang, W., Zhu, H., Livshits, V., Zhou, X.S. (2021). Characterization and calibration of volume-to-capacity ratio in volume-delay functions on freeways based on a queue analysis approach. Proceedings of the 100th TRB Annual Meeting, Washington, D.C.
- Cheng, Q., Liu, Z., Guo, J., Wu, X., Pendyala, R., Belezamo, B., Zhou, X.S. (2022). Estimating key traffic state parameters through parsimonious spatial queue models. Transportation Research Part C, 137, 103596. DOI
- Belezamo, B., Wu, X. (corresponding), Avcı, C., Zhou, X. (2019). Kinematic wave-oriented Markov chain model to capture the spatiotemporal correlations of coupled traffic states. IEEE ITSC 2019, 2343–2348.
- Zhuge, L., Li, W., Guo, J., Xian, K., Wu, X., Zhou, X. (2018). A tree-based reoptimization framework for solving traffic assignment problem in rapid decision making applications. CICTP 2018, 205–214.
Figures are reproduced from the author’s own publications for scholarly, non-commercial illustration; please cite the original articles.